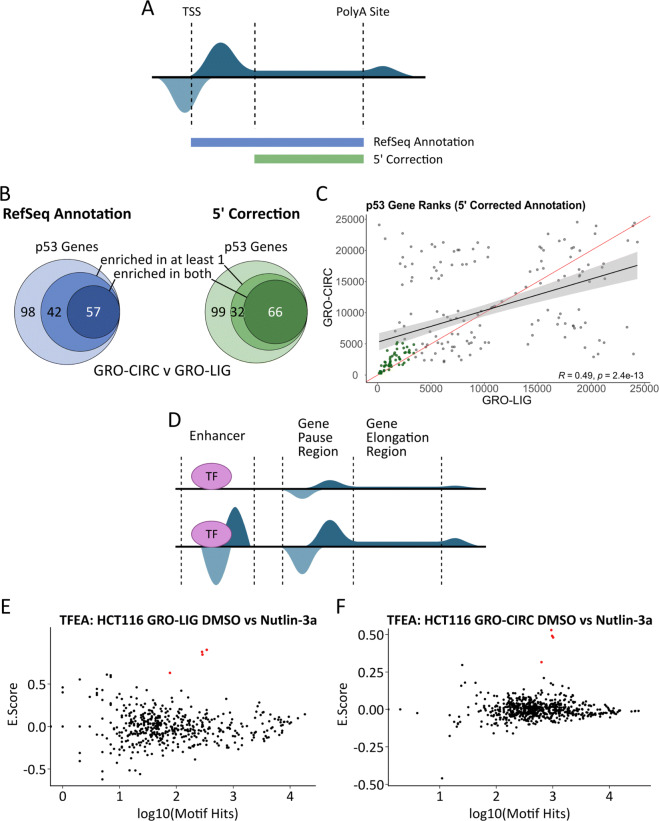
Fig. 5.
TFEA and DESeq2 analyses of library preparation methods. A Cartoon schematic demonstrating uncorrected (RefSeq Annotation) and 5′ corrected counting methods. B GSEA gene rank comparison of HALLMARK_P53 Gene set. Overlap is shown as genes that enrich in both datasets, genes that enrich in only one dataset, and genes that do not enrich in either dataset (Left: Uncorrected annotation, hypergeometric test p-value=4.32e-15; Right: Corrected annotation, hypergeometric test p-value=9.03e-22). C Scatterplot of comparative gene ranks for all p53 genes. Points in green indicate significant enrichment, as in (B). (Red line: y=x trendline, black line:line of best fit). D Representation of nascent transcription data set. Bidirectional transcripts occur at active enhancer sites and gene start sites. Enhancer transcription co-occurs with upregulated gene transcription, indicating transcription factor activation. E TFEA results for GRO-LIG (Left) and GRO-CIRC (Right). p53 family (p53, p63, p73) highlighted by red dots

