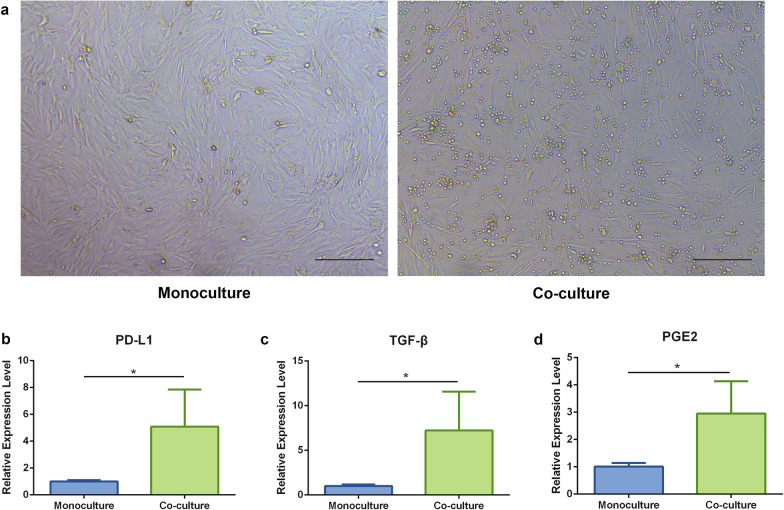
Fig. 7.
Gene expression level of PD-L1, TGF-β, and PGE2 in ADSCs. a Representative photomicrographs of the monocultured (left) and co-cultured (right) ADSCs after 72 h of incubation. Scale bar = 200 μm. Relative gene expression levels of b PD-L1, c TGF-β, and d PGE2 in the monocultured and co-cultured Th17 cells determined by qPCR. n = 5 per group. *p < 0.05. ADSCs, Adipose-derived stem cells; PD-L1, programed death ligand 1; TGF-β, transforming growth factor-beta; PGE2, prostaglandin E2; qPCR, quantitative real-time polymerase chain reaction

