Fig. 1.
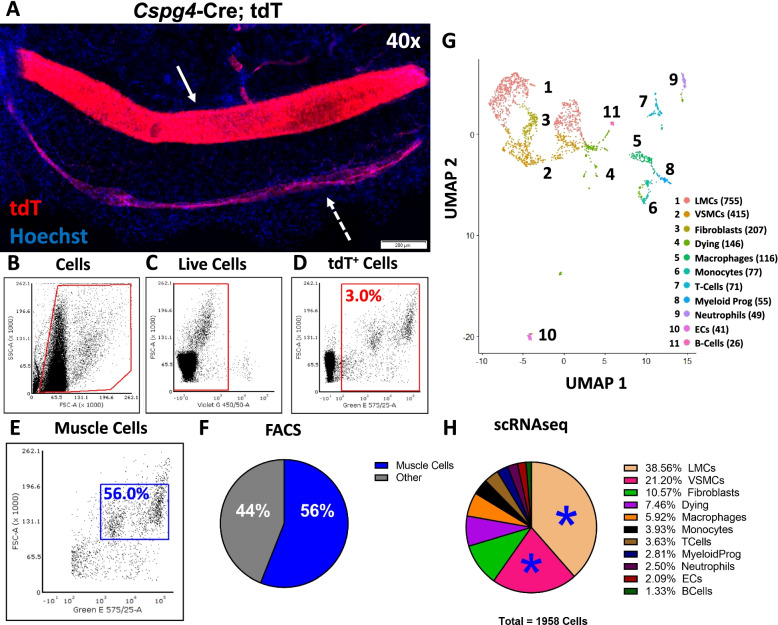
FACS enrichment of tdT+ SMCs from lower limb vasculature of Cspg4-Cre;Ai9-tdTomato mice validated by scRNAseq. Popliteal lymphatic vessel (PLV) (dashed arrow) and the adjacent superficial saphenous vein (SSV) (solid arrow) from Cspg4-Cre;tdTomato (tdT) mice were processed for whole mount fluorescent microscopy [22], and a representative × 40 image is shown (A). A single-cell suspension was prepared by pooling the digested SSV and both adjacent PLVs from the hindlegs of Cspg4-Cre;tdT mice (n = 3), which were sequentially sorted by fluorescence activated cell sorting (FACS) to exclude debris (B), and enrich for live (DAPI−, C) and tdT+ cells (D). Two replicates (n = 3 mice each) were performed with 16,896 (tdT1) and 2771 (tdT2) events sorted for downstream single-cell RNA-sequencing (scRNAseq) (red gates). Within the tdT+ events, two predominant cell populations were noted by tdT signal intensity (within blue rectangle in E), presumed to be tdTlo lymphatic muscle cells (LMCs) and tdThi vascular smooth muscle cells (VSMCs) based on the whole mount studies shown in (A). These two populations (inside blue rectangle in E) account for 56.0% of the sorted cells (9467 events vs 16,896 total tdT+ events for tdT1) (F). The two tdT replicates were integrated, and UMAP was used to embed the data into 2D space where a minimally supervised shared nearest neighbor (SNN) clustering algorithm resolved 11 clusters. Each cluster was labeled by cell type with number of cells for each cluster in parentheses, and numbers on the UMAP correspond with the cluster order (G). Together, the LMC and VSMC populations (blue stars) represent 59.8% of the total sequenced cells, consistent with the FACS analysis shown in (E and F H)

