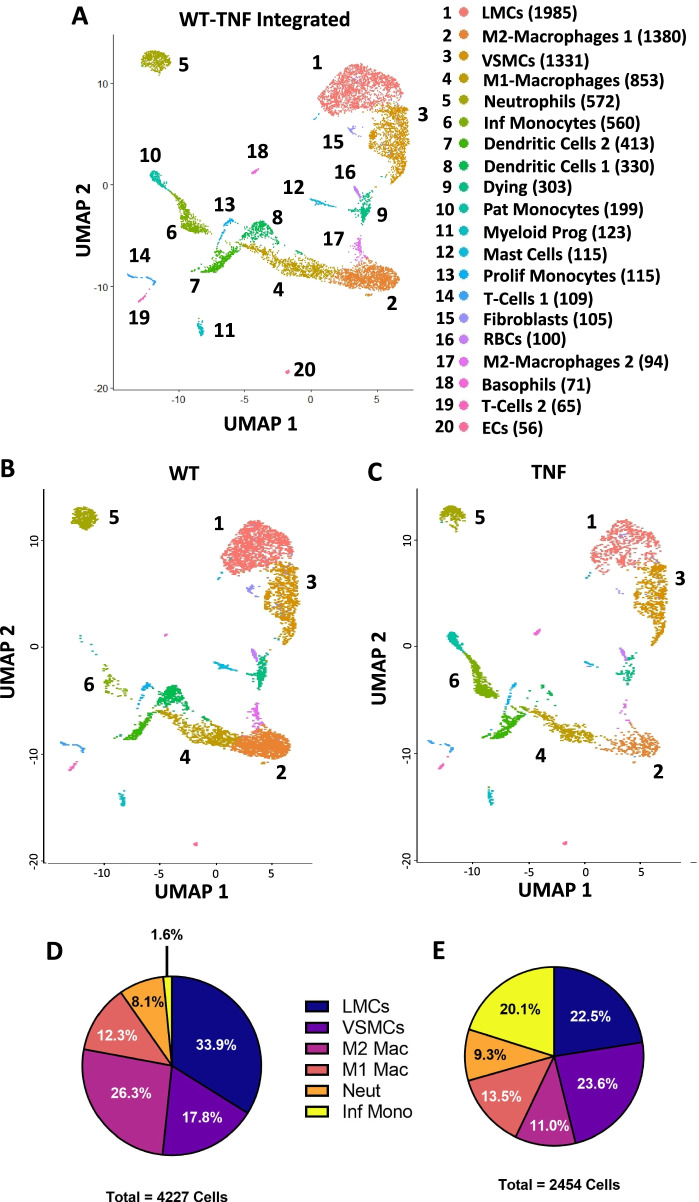
Fig. 3.
Decreased LMCs and M2-macrophages with increased inflammatory monocytes from peripheral vasculature of TNF-Tg arthritic mice. To compare with the wild-type (WT) dataset described in Fig. 2, popliteal lymphatic vessels (PLVs) and superficial saphenous veins (SSVs) from 8–9-month-old tumor necrosis factor transgenic (TNF-Tg) mice (n = 3) with 6963 events were isolated by fluorescence activated cell sorting (FACS) for single-cell RNA-sequencing (scRNAseq). The WT and TNF-Tg datasets were integrated and the unsupervised shared nearest neighbor (SNN) clustering algorithm in Seurat resolved 20 distinct cell clusters from the 8879 total cells (5488 WT and 3391 TNF) analyzed. Each cluster was labeled by cell type with total number of cells for each cluster in parentheses and each cluster numbered on the UMAP (A). Sub-analysis of the top 6 most abundant cell populations in the WT (B) and TNF-Tg (C) samples was performed to assess changes in cell proportions between the conditions. In the 4227 subclustered cells from the WT dataset, a small proportion of the cells represented inflammatory monocytes (1.6%), while lymphatic muscle cells (LMCs) (33.9%) and M2 macrophages (26.3%) were the predominant cell populations (D). In the 2454 subclustered cells from TNF-Tg mice, the inflammatory monocyte population expanded dramatically to 20.1%, while both LMCs and M2 macrophages decreased to 22.5% and 11.0%, respectively (E). The cell counts and percentages for each cluster between WT and TNF-Tg vasculature are provided in Table 1. Supplementary Figure 4 describes the markers used to define the specific monocyte and macrophage populations, while Fig. 4 and Supplementary Figures 5, 6, and 7 together describe the identification of LMCs

