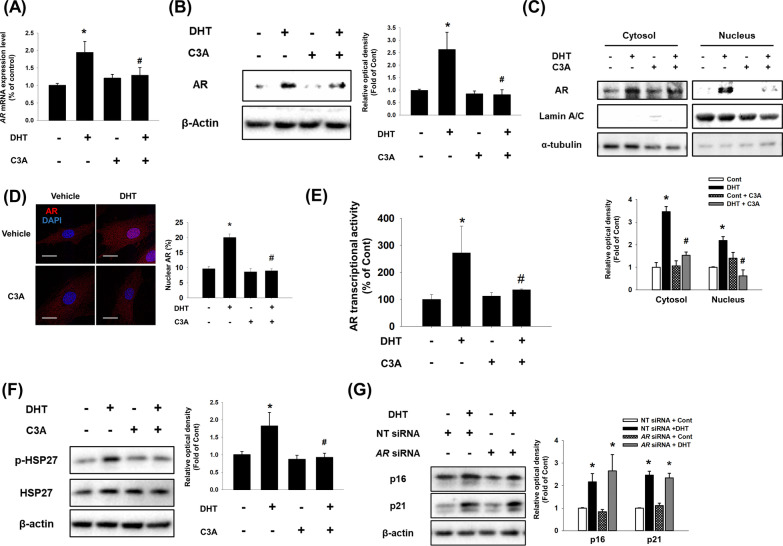
Fig. 2.
Effect of C3A on DHT-induced nuclear translocation of AR. A–F DPCs were treated with C3A for 30 min prior to DHT for 24 h. A The relative mRNA expression level of AR was analyzed by real time PCR. Normalization was achieved by ACTB mRNA expression level (B) AR protein expression level was detected by western blot analysis. N = 3. C Nuclear and cytosolic proteins were separated by intracellular fractionation. Protein expression level of AR was detected. Lamin A/C was used as a nuclear marker, and α-tubulin was used as a cytosol marker. N = 3. D Cells were immunostained with anti-AR antibody (red). Nucleus is counterstained with DAPI (blue). N = 3. Magnification ×1000. Scale bars are 8 μm. E AR transcriptional activity was analyzed by Cignal reporter assay. N = 5. F Phosphorylated HSP27 and HSP27 protein expression levels were analyzed by western blotting. N = 3. G Cells were transfected with non-targeting (NT) siRNA (25 nM) and AR siRNA (25 nM) and treated with DHT for 72 h. Western blotting analysis was performed for p16 and p21 proteins. β-actin was used as a loading control. N = 3. Data are mean ± SEM. *p < 0.05 versus Control. #p < 0.05 versus DHT

