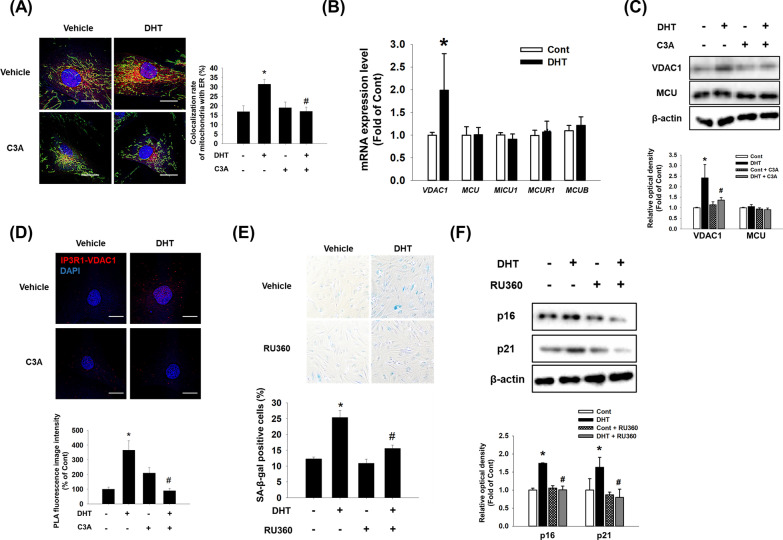
Fig. 4.
Effect of C3A on DHT-induced ER-mitochondria contacts. A DPCs were treated with C3A and exposed to DHT for 24 h. Cells were visualized by staining with ER-Tracker (200 nM) and Mito-Tracker (200 nM). Colocalization of ER-Tracker and Mito-Tracker was analyzed by Image J software. N = 5. Magnification ×1000. Scale bars are 8 μm. B Cells were treated with DHT for 24 h. The mRNA expression levels of VDAC1, MCU1, MICU1, MCUR1, and MCUB were quantified by qPCR analysis. N = 5. C Cells were treated with C3A for 30 min and exposed to DHT for 24 h. Protein expression levels of MCU1 and VDAC1 were analyzed by western blotting. N = 4. D Interaction between VDAC1 and IP3R1 (VDAC1–IP3R1, red) in DPC cells was assessed by PLA assay. N = 4. Magnification ×1000. Scale bars are 8 μm. E, F Cells were pretreated with RU360 (1 μM) for 30 min and exposed to DHT for 72 h. E SA-β-gal activity assay was performed, and blue stained cells of total cells were counted. N = 5. F Protein expression levels of p16 and p21 were quantified by western blot analysis. N = 4. *p < 0.05 versus Control. #p < 0.05 versus DHT

