
Fig. 1.
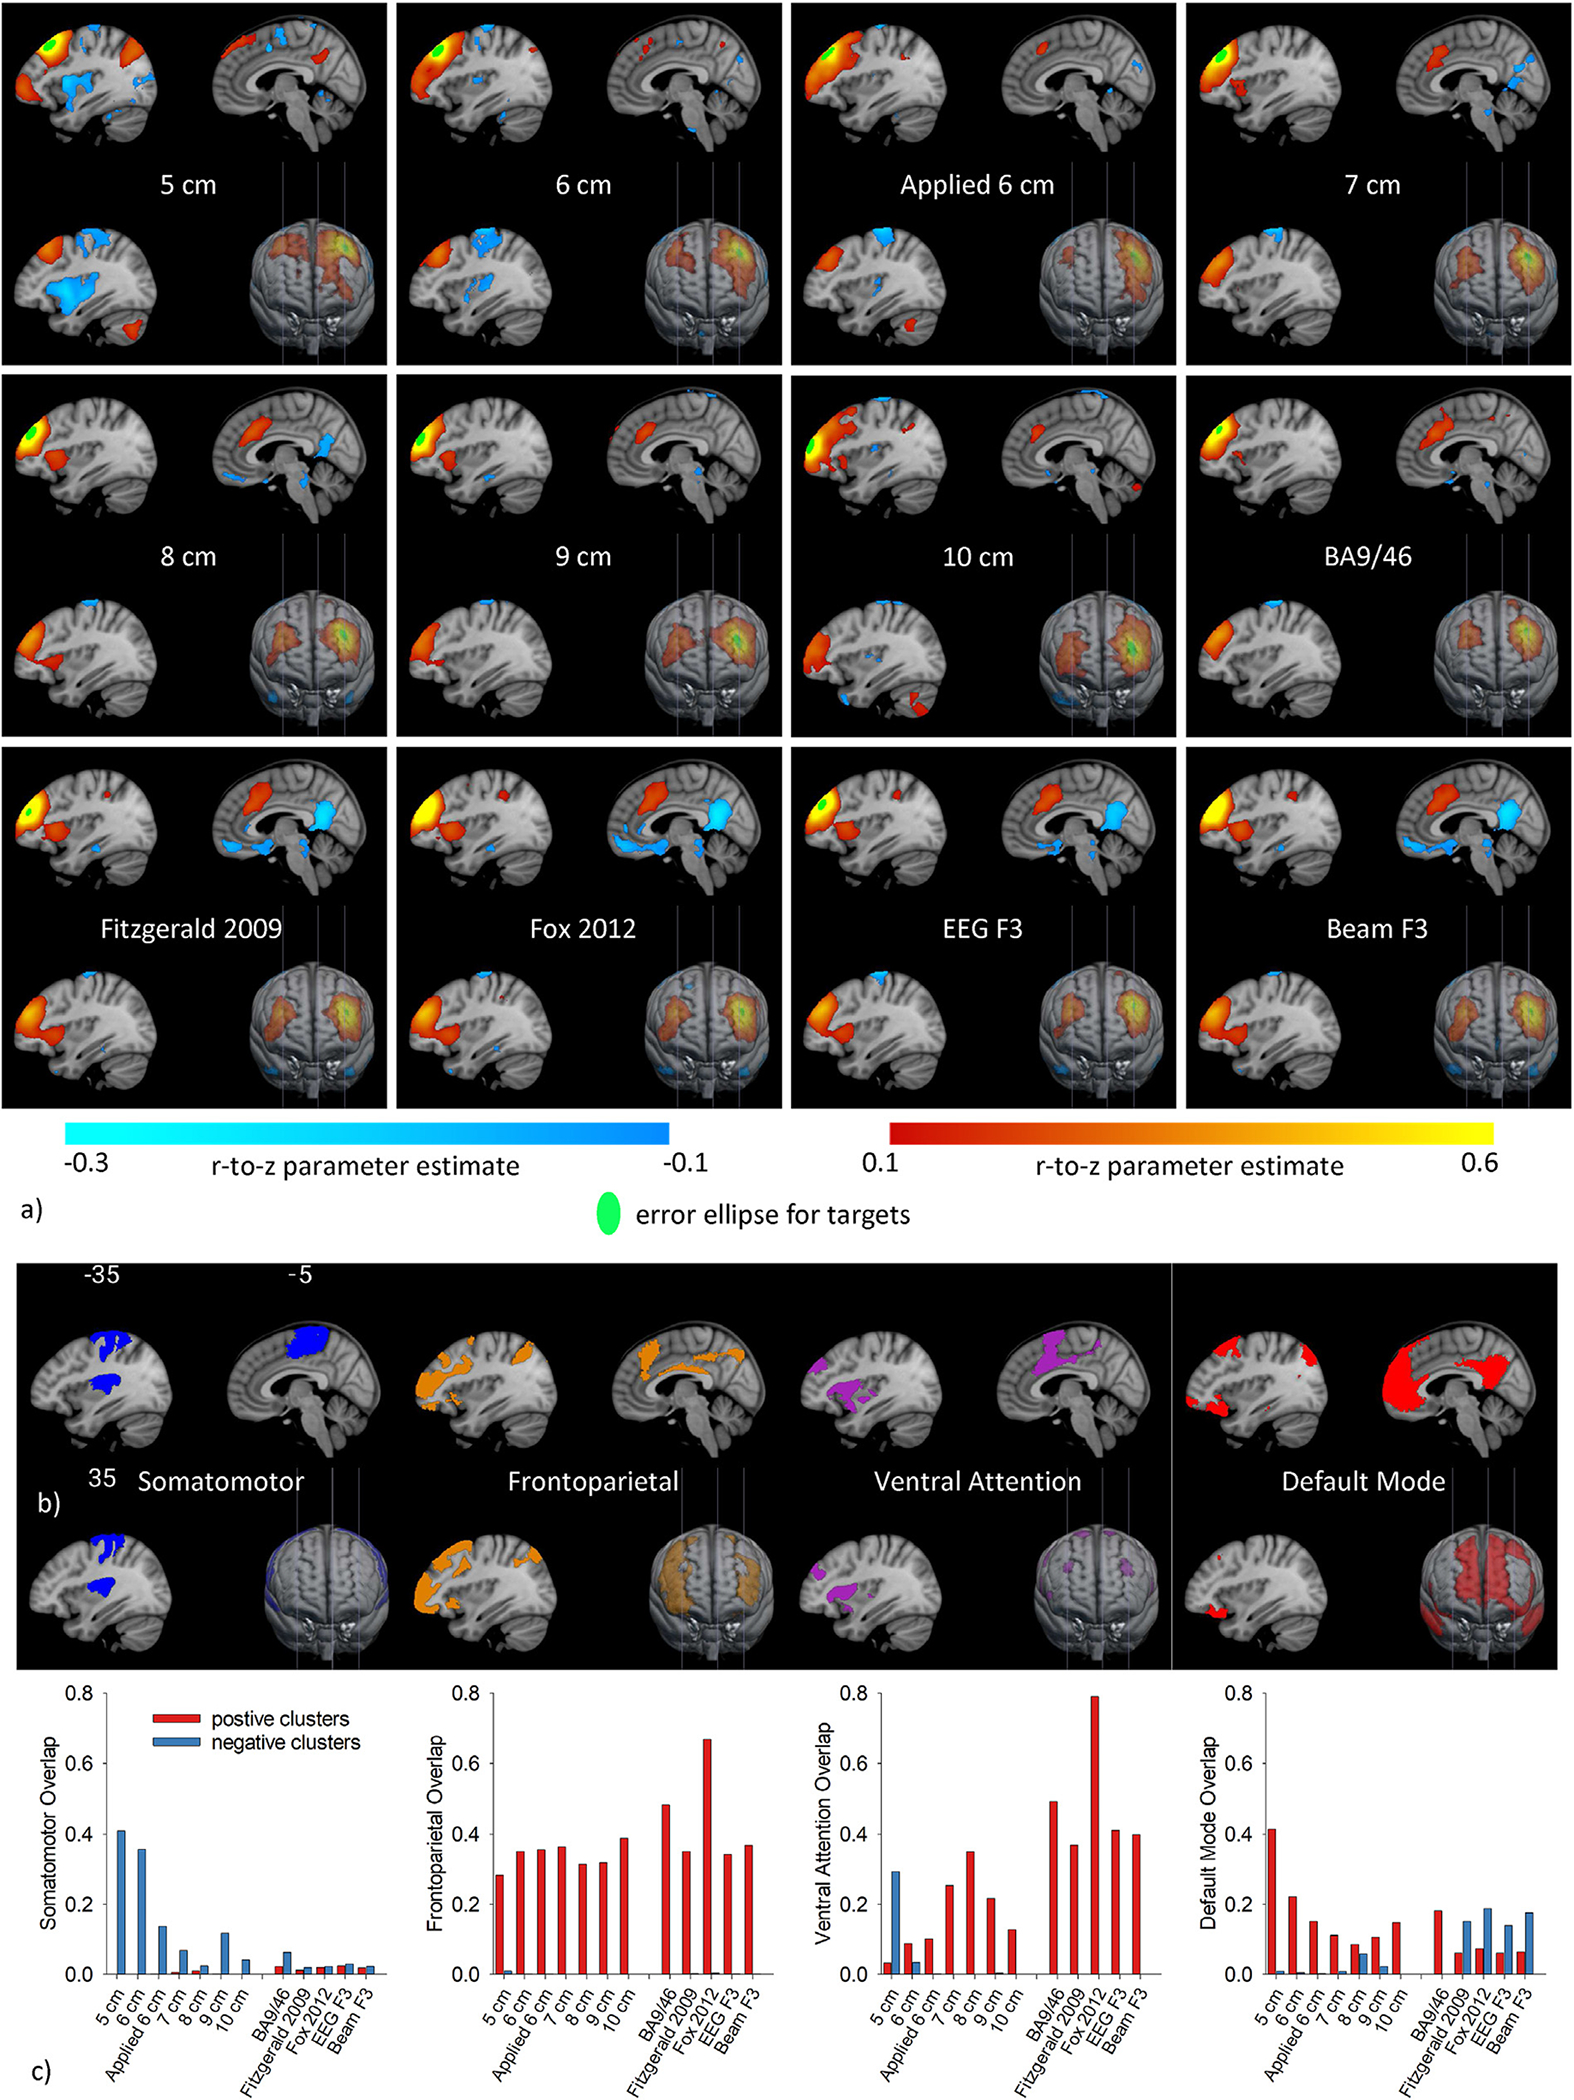
a) Resting-state networks (average r-to-z across maps generated from 10 mm spherical seeds placed at each individual’s virtual target correlated with all other voxels) for each rule at 3 sagittal slices (MNI x = −35, −5, and 5 mm) and a 3D view from the front. Only significant (corrected on cluster size, p < 0.05) connections with magnitude greater than 0.1 are displayed. Overlaid on the maps is the green error ellipse showing the average location and dispersion of target centers across patients for each rule. b) The spatial distribution of the somatomotor, frontoparietal, ventral attention, and default mode networks as defined by Yeo. c) Bar graphs of the dice overlap between resting-state networks connected to each rule’s virtually traced targets and the Yeo networks.