
Fig. 4.
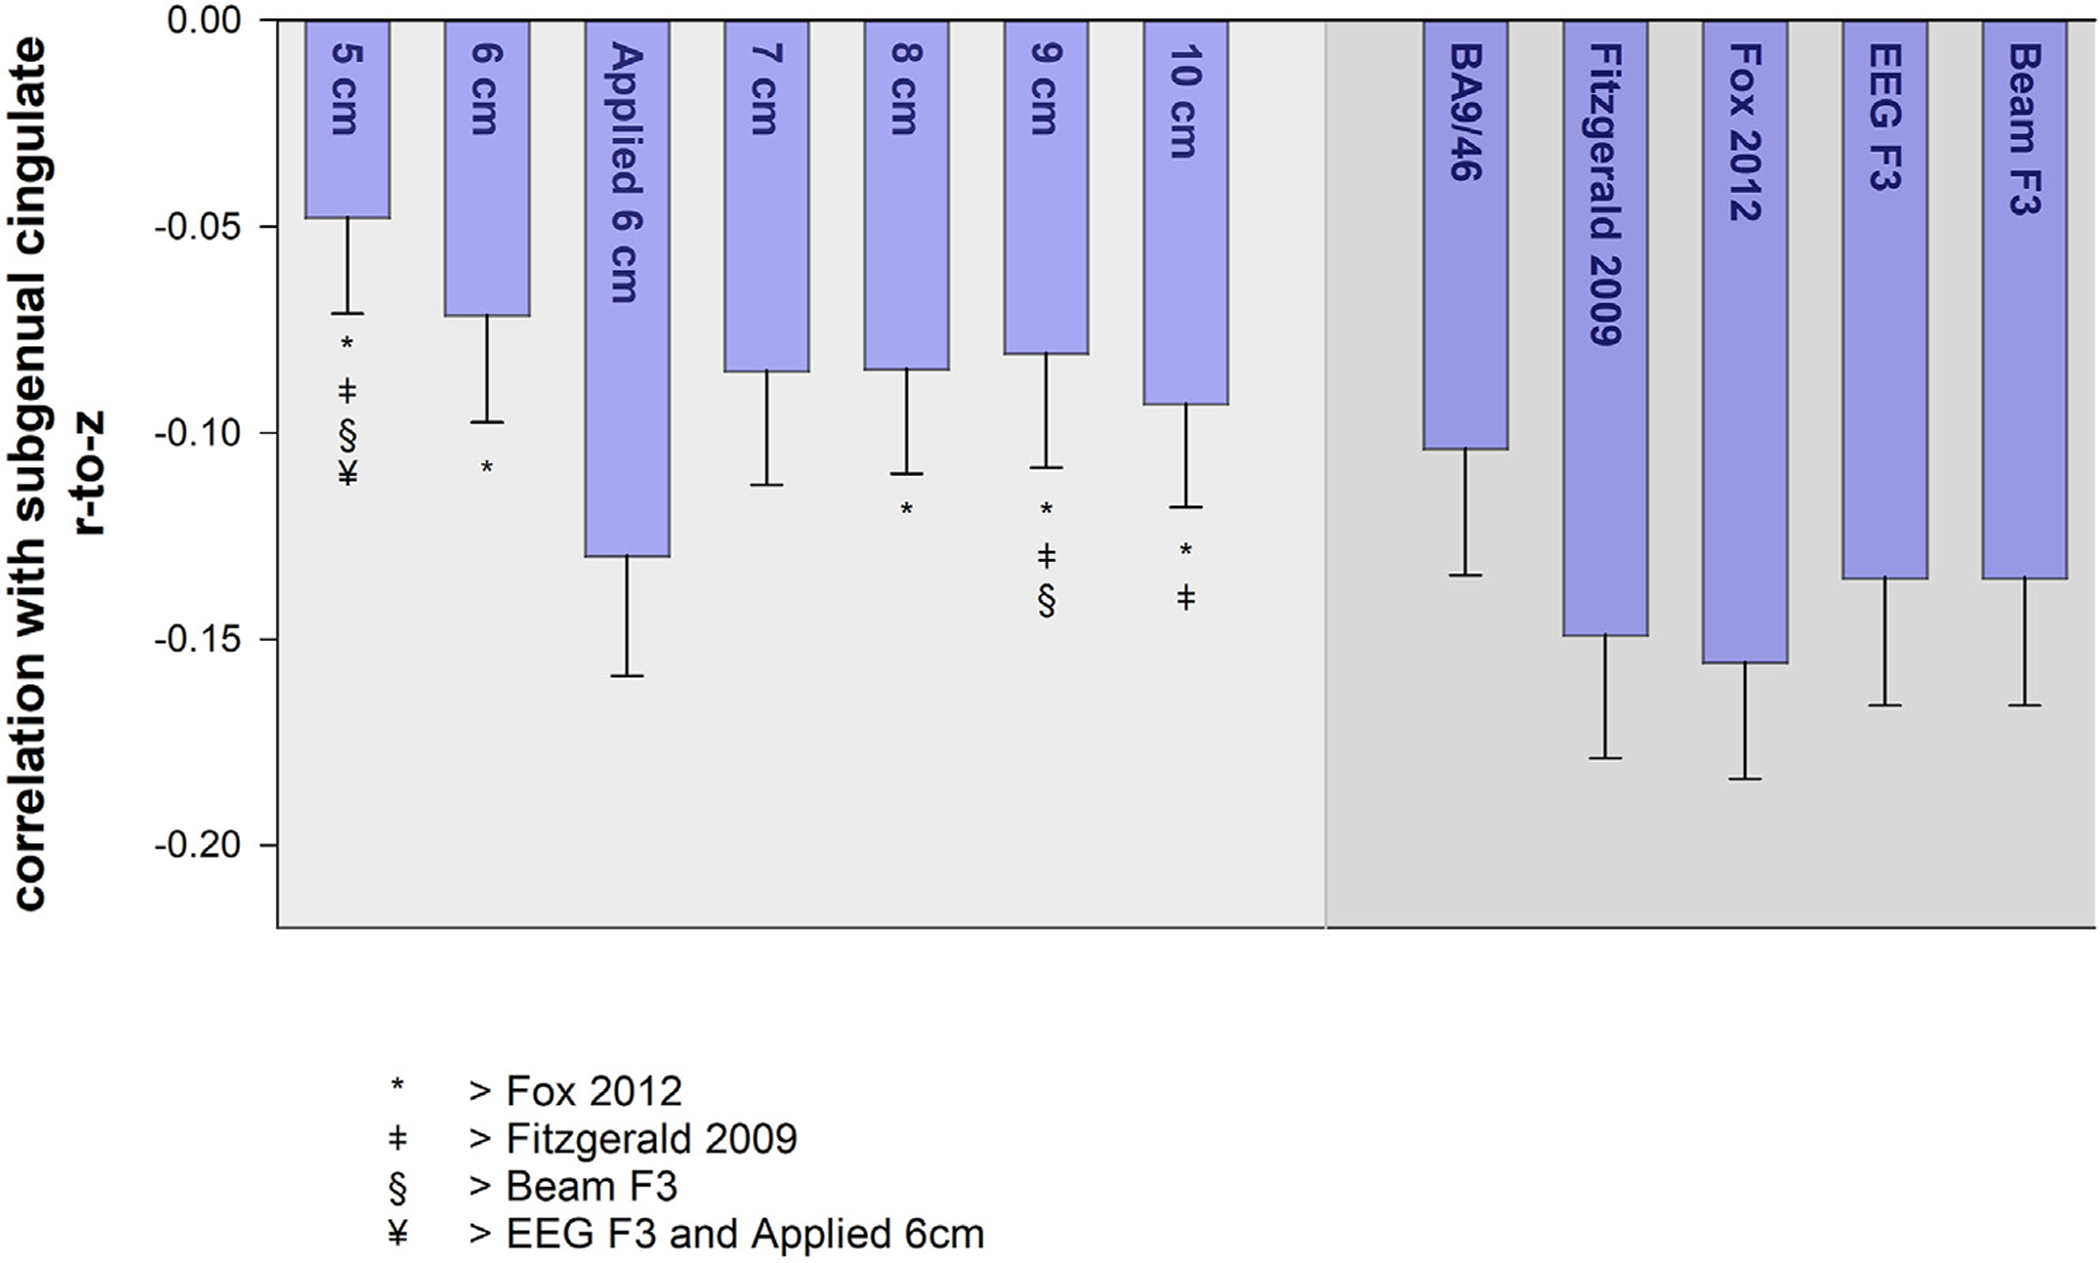
Bars show the average correlation ± standard error between the subgenual cingulate and targets for each rule. Symbols denote rules with larger correlations (i.e., smaller anticorrelations).
Official websites use .gov
A
.gov website belongs to an official
government organization in the United States.
Secure .gov websites use HTTPS
A lock (
) or https:// means you've safely
connected to the .gov website. Share sensitive
information only on official, secure websites.
Bars show the average correlation ± standard error between the subgenual cingulate and targets for each rule. Symbols denote rules with larger correlations (i.e., smaller anticorrelations).