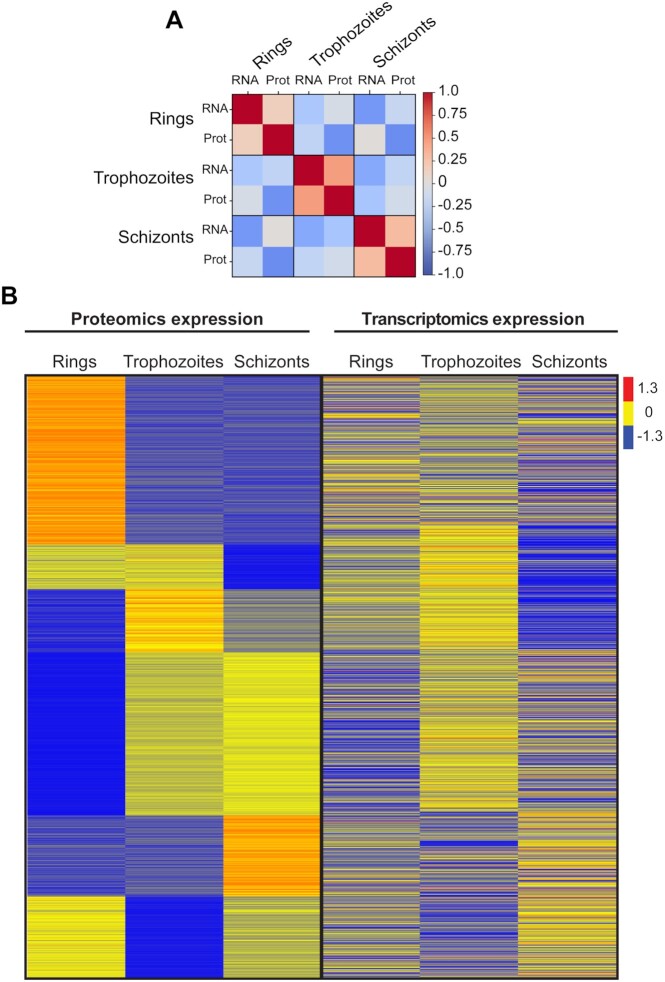
Figure 8:
Heat map of the P. falciparum gene and protein expression patterns from ring- to trophozoite- to schizont-stage parasites. (A) Pearson correlation of mean protein intensities (1,990 common proteins identified in Experiments 1 and 2) in each specific stage (ring-, trophozoite-, and schizont-stage parasites) to RNA transcript abundance from Toenhake et al. [26]. (B) Left: Proteomics data (DIA) of 1,990 common proteins from ring- to trophozoite- to schizont-stage parasites in Experiments 1 and 2. Right: Transcriptomics data from Toenhake et al. [26]. The colour code is as follows: red indicates up-regulated proteins or transcripts; blue indicates down-regulated proteins or transcripts; yellow indicates unchanged proteins or transcripts.

