
Figure 4.
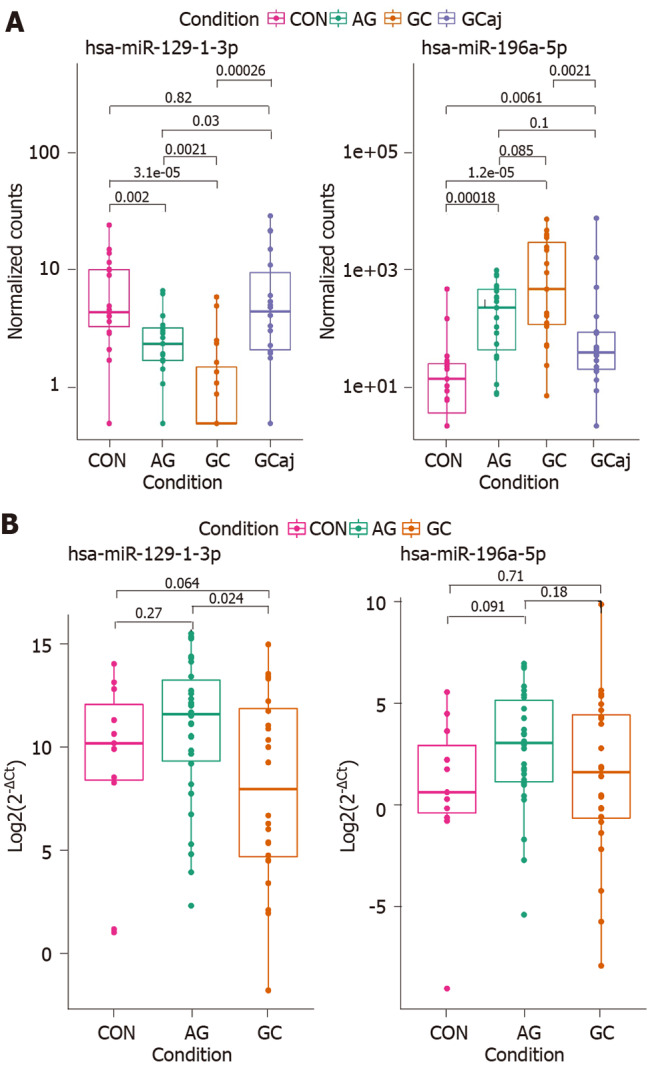
Hsa-miR-129-1-3p and hsa-miR-196a-5p expression levels in study comparison groups. A: Atrophic gastritis and gastric cancer tissue samples compared to controls; B: Atrophic gastritis and gastric cancer plasma samples compared to controls. Box plot graphs; boxes correspond to the median value and interquartile range. CON: Control; AG: Atrophic gastritis; GC: Gastric cancerous; GCaj: Gastric adjacent tissue.