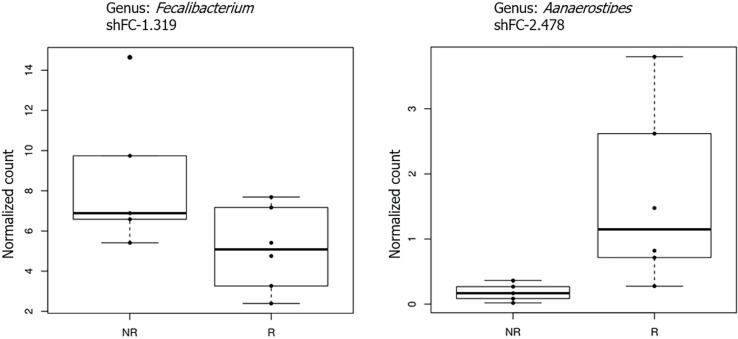
Figure 6.
Boxplots showing the results of taxa-level differential abundance analysis between immunological responders and immunological non-responders at 24 wk. Plot titles report the shrunk Log2 fold change (according to the DESeq2 function lfcShrink). All results have a P value < 0.05. NR = INRs, R = IRs. IRs: Immunological responders; INRs: Immunological non-responders.

