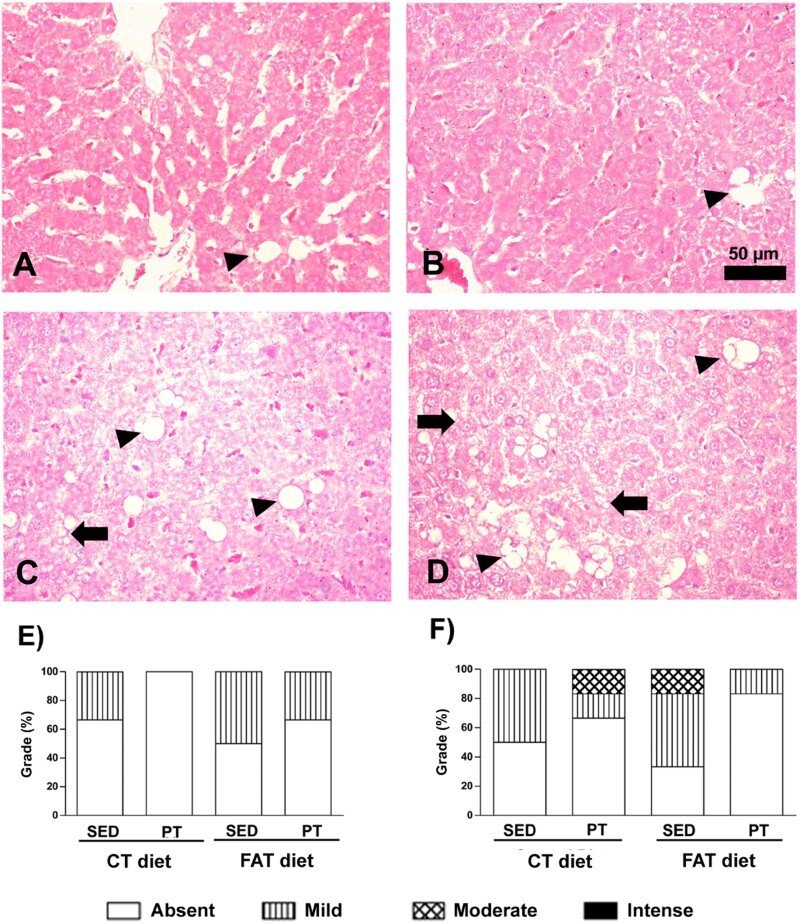
Figure 4.

Photomicrographs of liver stained with hematoxylin and eosin (HE). Arrow indicates microvesicular steatosis, and arrowhead indicates macrovesicular steatosis. (A) Rat fed with a control (CT) diet and maintained sedentary (SED). (B) Rat submitted to a control (CT) diet and physical training (PT). (C) Rat submitted to a high-fat (FAT) diet and maintained sedentary (SED). (D) Rat submitted to a high-fat (FAT) diet and physical training (PT). Magnification 440×. Bar = 50 μ. Qualitative evaluation of macrovesicular steatosis (E) and microvesicular steatosis (F) in liver tissue, using a grade from absent to mild, moderate or intense.
