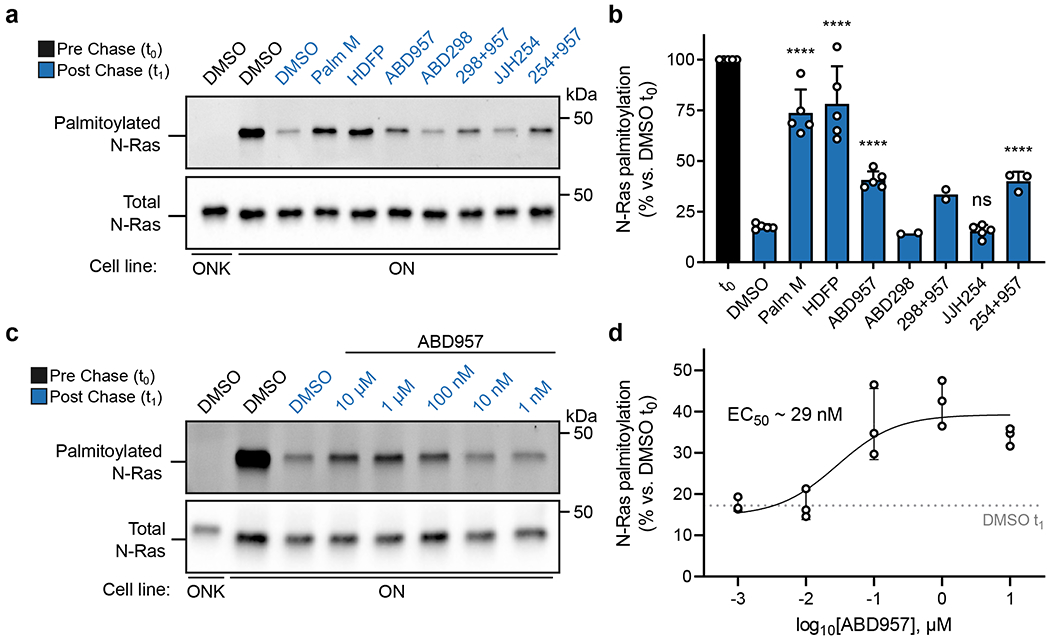
Figure 2. Effects of inhibitor treatment on the dynamic palmitoylation state of N-Ras.

a, Representative gel measuring N-Ras palmitoylation by 17-ODYA comparing effect of treatment with Palm M (10 μM), HDFP (20 μM), ABD957 (500 nM), ABD298 (500 nM), and JJH254 (1 μM) in OCI-AML3 cells stably expressing GFP-N-RasG12D (ON) with GFP-N-RasG12D-KRAS-HVR (ONK) as a control (upper panel). Samples co-treated with ABD957 and ABD298 or JJH254 are abbreviated as 298+957 and 254+957 respectively. Gel is representative of 5 independent experiments (only one including ABD298, three including JJH254, and 5 for all other conditions). N-Ras was immunoprecipitated via GFP and the degree of palmitoylation visualized by rhodamine attached via CuAAC to the alkyne of 17-ODYA. Total N-Ras content was measured by Western blotting of GFP enrichments (lower panel). b, Quantification of inhibitor effects on dynamic palmitoylation. Data represent average values ± s.d. (biological replicates; n = 2 for ABD298 and ABD298 + ABD957 samples, n = 3 for JJH254 + ABD957 samples, and n = 5 for all others). Statistical significance was calculated using unpaired two-tailed Student’s t-test with equal variance, ****P<0.0001 represents significant increase compared to DMSO t1. P values were 4.9×10⁻⁶ (Palm M), 8.3×10⁻⁵ (HDFP), 2.5×10⁻⁶ (ABD957), 0.19 (JJH254), 3.9×10⁻⁵ (JJH254 + ABD957). c, Representative gel (from 3 independent experiments) measuring N-Ras palmitoylation by 17-ODYA in the presence of varying concentrations of ABD957 (upper panel). Dotted line represents mean of residual post-chase DMSO (t1) signal. N-Ras was enriched and visualized as described in a. Total N-Ras content was measured by Western blotting of GFP enrichments (lower panel). d, Quantification of concentration-dependent effects of ABD957 on N-Ras palmitoylation. Data are plotted from biological replicates, and error bars represent s.d. and center around the mean (n = 3 independent experiments).
