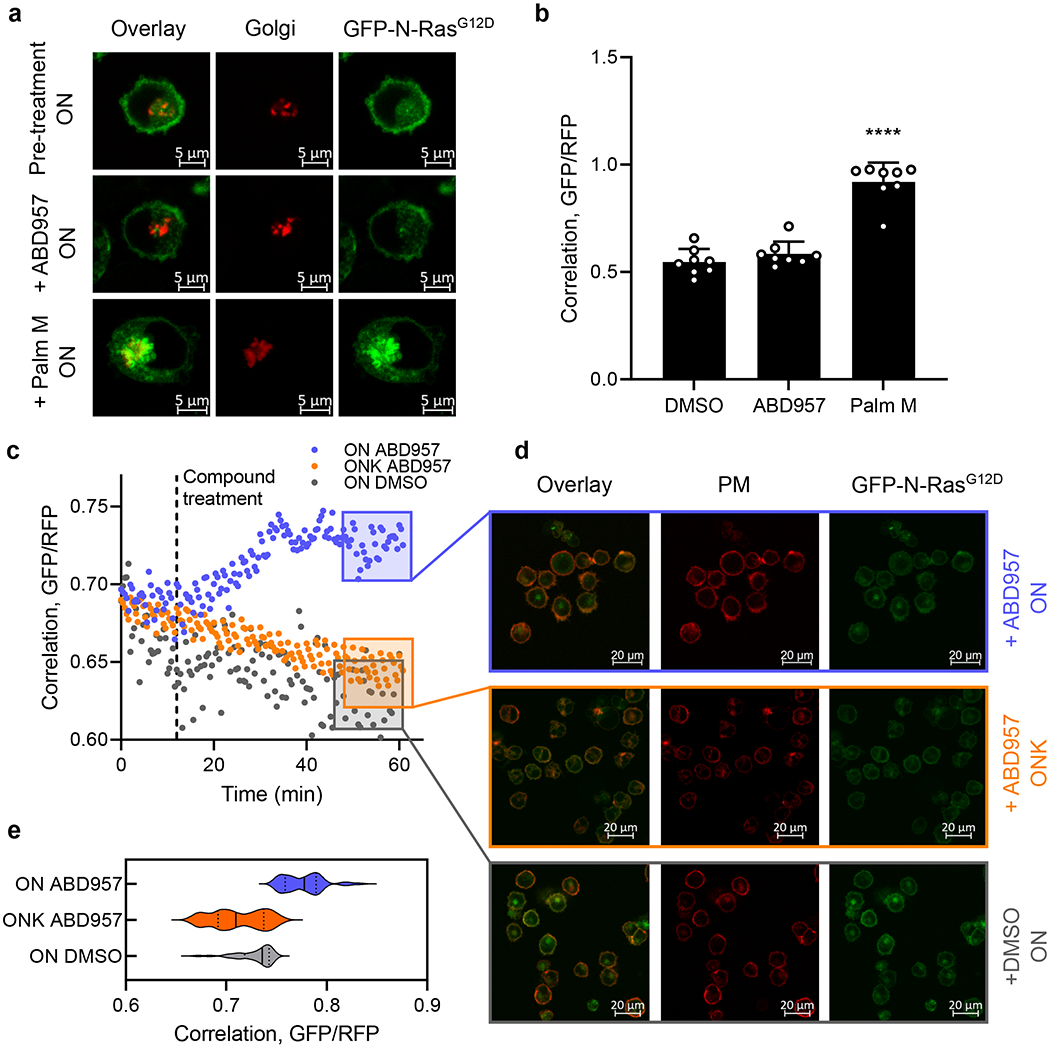
Figure 4. Effect of inhibitor treatment on GFP-N-Ras localization in ON and ONK cells.

a, Representative images from eight biological replicates of cells co-stained with the Golgi marker RFP-N-acetylgalactosaminyltransferase (RFP-GALNT2) before and after treatment with Palm M (10 μM) or ABD957 (500 nM). Red channel shows Golgi marker (middle), green channel shows GFP-N-Ras (right), and overlay of the two markers (left). Scale bar, 5 μm. b, Change in N-Ras colocalization to the Golgi, as a representative endomembrane compartment, measured by co-staining with RFP-GALNT2 after 10-minute compound treatment. Colocalization is quantified using the Mander’s correlation coefficient between GFP-N-Ras and RFP-GALNT2 signal. Data represent average values ± s.d. (n = 8 individual cells per group). Statistical significance was calculated with unpaired two-tailed Student’s t-test with equal variance, ****P<0.0001 represents significant increase compared to DMSO. P value 1.4×10⁻⁷. c, Real-time quantification of colocalization of GFP-N-Ras signal intensity and the plasma membrane marker Alexa-647-conjugated wheat germ agglutinin (WGA) in ON (purple) and ONK cells (orange) treated with ABD957 (1 μM at t = 10 minutes), in comparison to ON cells treated with DMSO (grey). Colocalization between GFP and RFP was quantified as in b and the correlation coefficient is shown on the y-axis. Images were acquired every 2 minutes for 10 minutes, then medium was infused with ABD957 and images collected for an additional 50 minutes (see Methods for details). Data shown are representative of three biological replicates. d, Representative images taken from c at t = 60 minutes (purple, yellow and grey boxes). Red channel shows plasma membrane staining with Alexa-647-conjugated WGA (middle), green channel shows GFP-N-Ras (right) and the overlay of the two markers is also shown (left). Treatment with ABD957 in ON (top) and ONK (middle) or DMSO in ON cells (bottom). Scale bar, 20 μm. e, Violin plot of cumulative colocalization between GFP-N-Ras and Alexa-647-conjugated WGA at t = 60 minutes after treatment with ABD957 or DMSO in ON or ONK cells is shown across three biological replicates of time-course experiments as shown in c. Median values represented by solid lines, lower and upper quartiles indicated by dotted lines. Also see Supplementary Video 1a–c.
