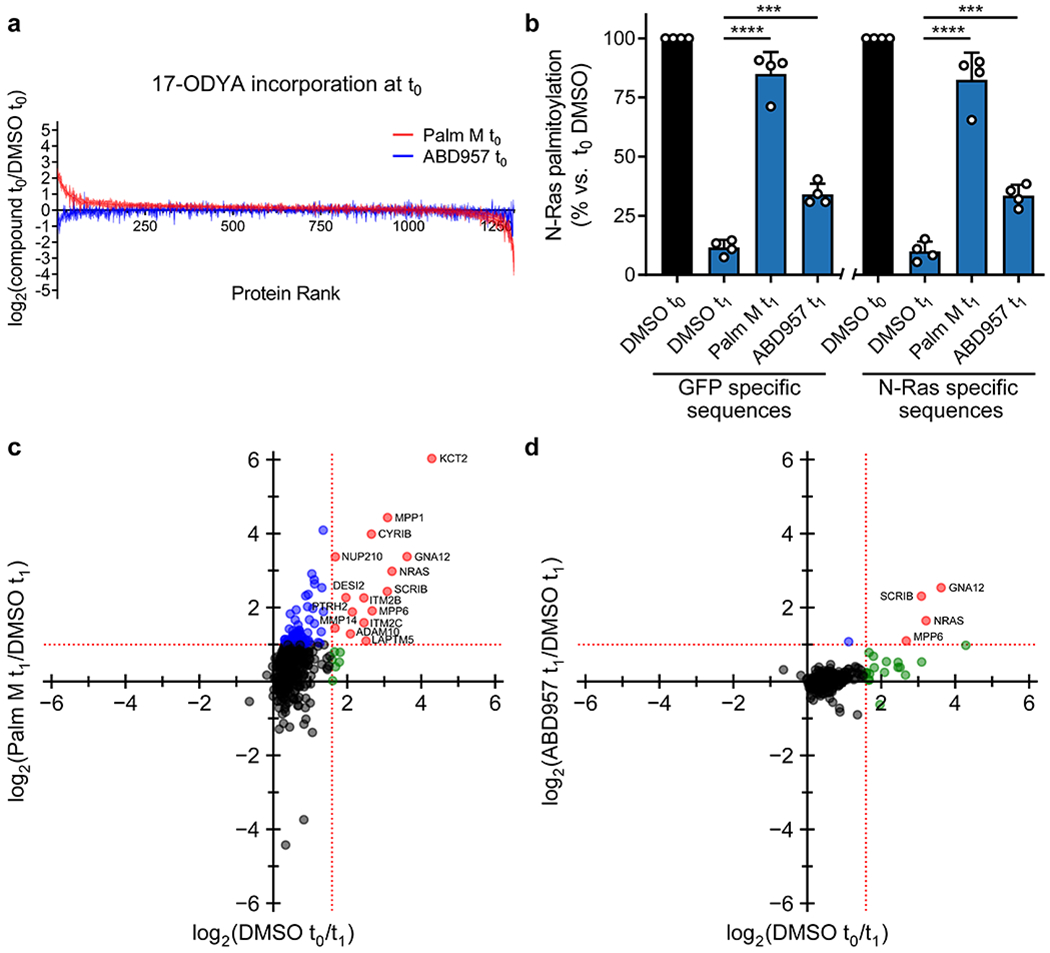
Extended Data Fig. 4. Global palmitoylation effects of Palm M and ABD957 in leukemia cells.

a, MS-based proteomics in OCI-AML3 cells showing the 17- ODYA labeling at t0. The results indicate that Palm M increases the apparent palmitoylation state of several proteins prior to the chase period and, as shown in Fig. 3a, some of these proteins are not dynamically palmitoylated (blue proteins in Fig. 3a). b, Bar graph quantifiying different categories of N-Ras peptides from MS-based proteomics experiments in ON cells. Data represent average values relative to DMSO t0 ± s.d. (n = 4 from two biological replicates). Statistical significance was calculated with unpaired two-tailed Student’s t-test with equal variance, ***P<0.001, ****P<0.0001 represent significant increase compared to DMSO t1 (also see Supplementary Dataset 3). P values were 5.5×10⁻⁵ (Palm M GFP specific), 1.8×10⁻⁴ (ABD957 GFP specific), 2.1×10⁻⁵ (Palm M N-Ras specific), 2.7×10⁻⁴ (ABD957 N-Ras specific). c, d, Scatter plots as described in Fig. 3a in ON cells.
