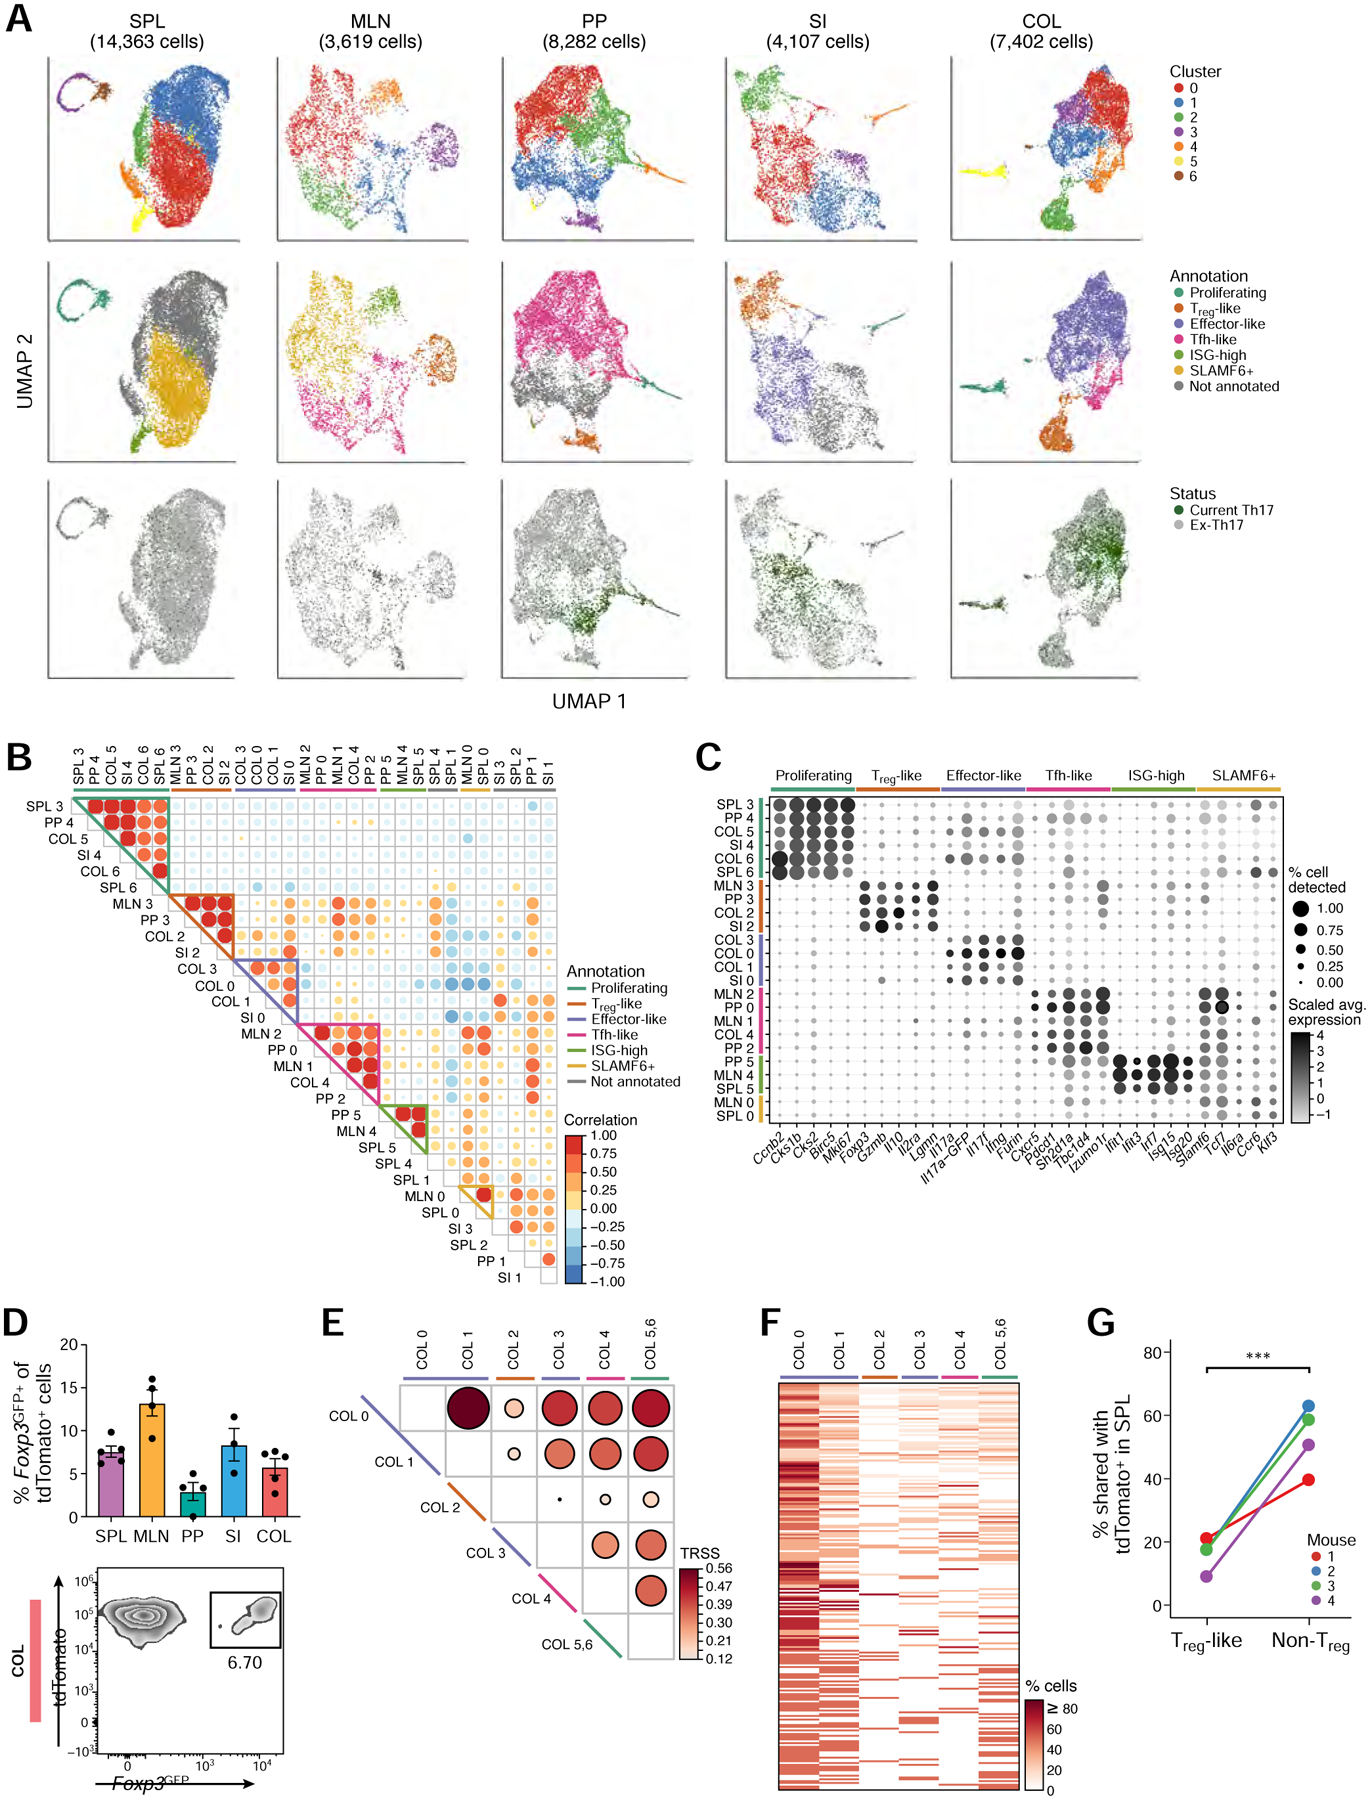
Figure 2: Intra-tissue heterogeneity of tissue Th17 cells revealed with single-cell analysis.

(A) UMAP visualization of all current (GFP+) and ex-Th17 cells (GFP−) at homeostasis, colored by cluster assignment (top row), cluster function annotation (middle row), and Th17 status (bottom row).
(B) Correlation of transcriptomic landscape for all pairs of intra-tissue clusters.
(C) Expression of selected genes used to define the intra-tissue cluster functional annotations.
(D) Frequency of Foxp3GFP+ of tdTomato+ cells by flow cytometry in each tissue (top, n=3–5). Representative flow cytometry plot of the colonic population (bottom).
(E) TCR repertoire similarity analysis across the colon tissue clusters. The two proliferating clusters (COL5 and COL6) were combined in this analysis.
(F) Clonotype sharing across colon clusters. All clonotypes (rows) found in at least two colon clusters (columns) were included.
(G) Percentage of Treg-like (cluster COL2) and non-Treg colonic tdTomato+ cells (all other clusters) that share their TCR sequences with splenic tdTomato+ cells (n=4).
