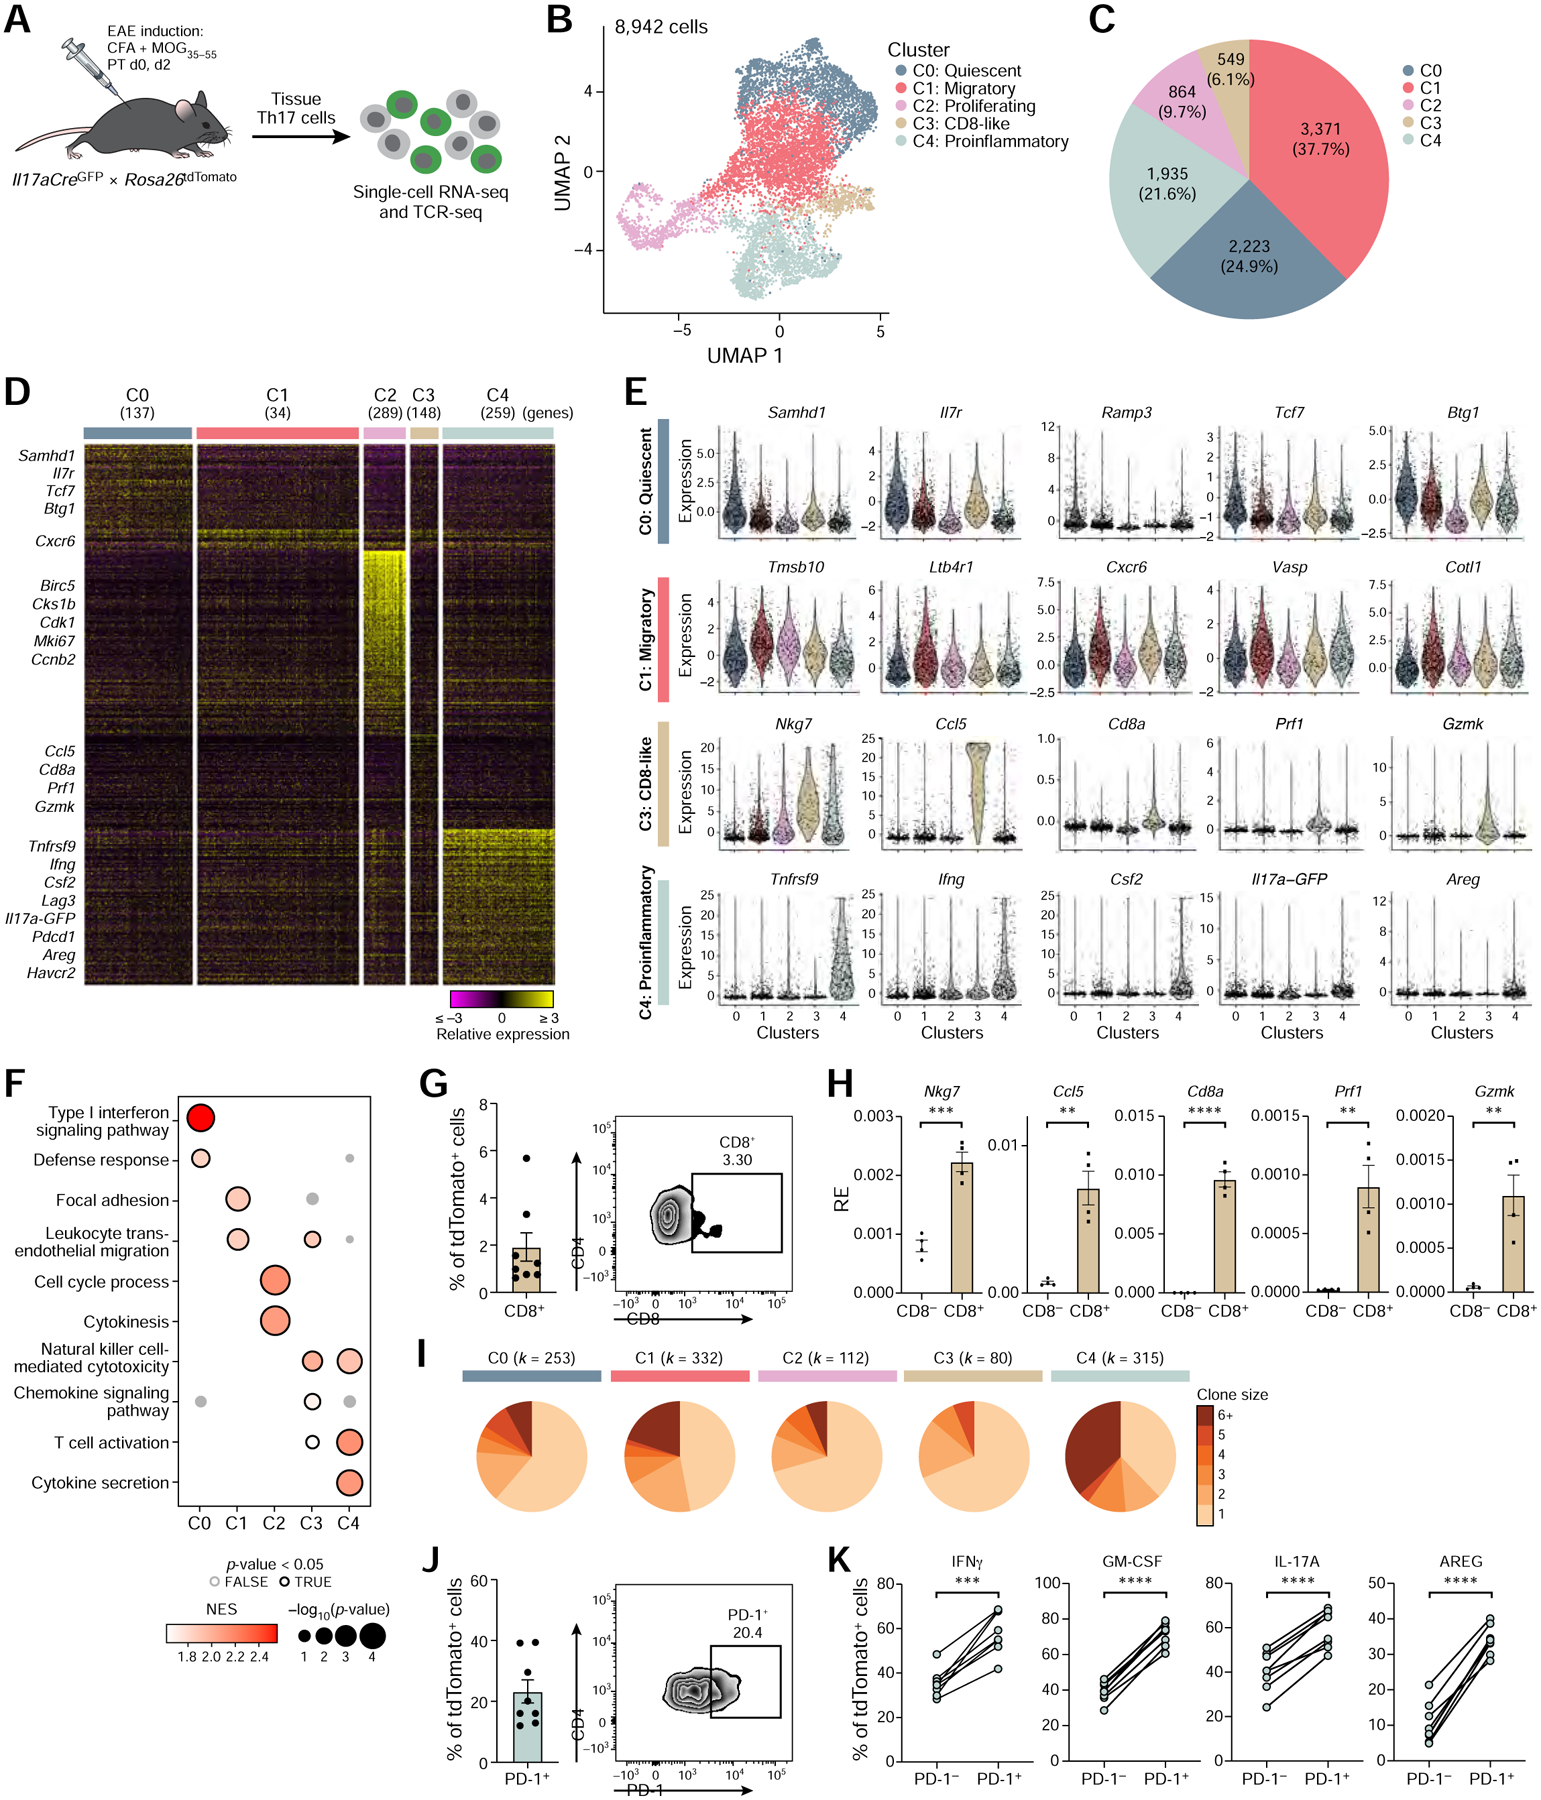
Figure 3: Identification of functionally distinct encephalitogenic Th17 cell subpopulations.

(A) Schematic of the experimental setup.
(B) UMAP representation of unsupervised clustering of current (GFP+) and ex-Th17 cells (GFP−) from the CNS of EAE mice at disease onset.
(C) Cell numbers and relative frequencies of each cluster.
(D) Relative expression of genes uniquely up-regulated in each cluster (Wilcoxon rank-sum test; FDR <0.05, fold change ≥1.5). Data are shown for a random sample of 1,000 cells.
(E) Expression of a selected set of cluster markers. Extreme expression values (<0.5 or >99.5 percentiles) were excluded and points were shown for randomly selected 20% of the cells.
(F) Selected GO terms and KEGG pathways from cluster-specific gene set enrichment analysis. Only positively enriched results were shown.
(G) CD8α expression by flow cytometry on viable TCRβ+ CD4+ tdTomato+ CNS cells (n=8). Quantification (left) and a representative flow cytometry plot (right).
(H) qPCR gene expression analysis of cluster 3 marker genes comparing CD8α− to CD8α+ tdTomato+ CNS cells (n=4). RE = Relative expression.
(I) Clonal expansion for each CNS cluster. Size of a pie slice represents the proportion of cells that belong to clones of the color-indicated size computed within each cluster. Number of cells is shown on the top. Clonal expansion scores for clusters (0–4) are 0.04, 0.07, 0.03, 0.03 and 0.13, respectively.
(J) PD-1 expression by flow cytometry on viable TCRβ+ CD4+ tdTomato+ CNS cells (n=8). Quantification (left) and a representative flow cytometry plot (right).
(K) Effector cytokine expression by flow cytometry in PD-1− and PD-1+ tdTomato+ CNS cells (n=8). Paired two-tailed t-tests were performed.
