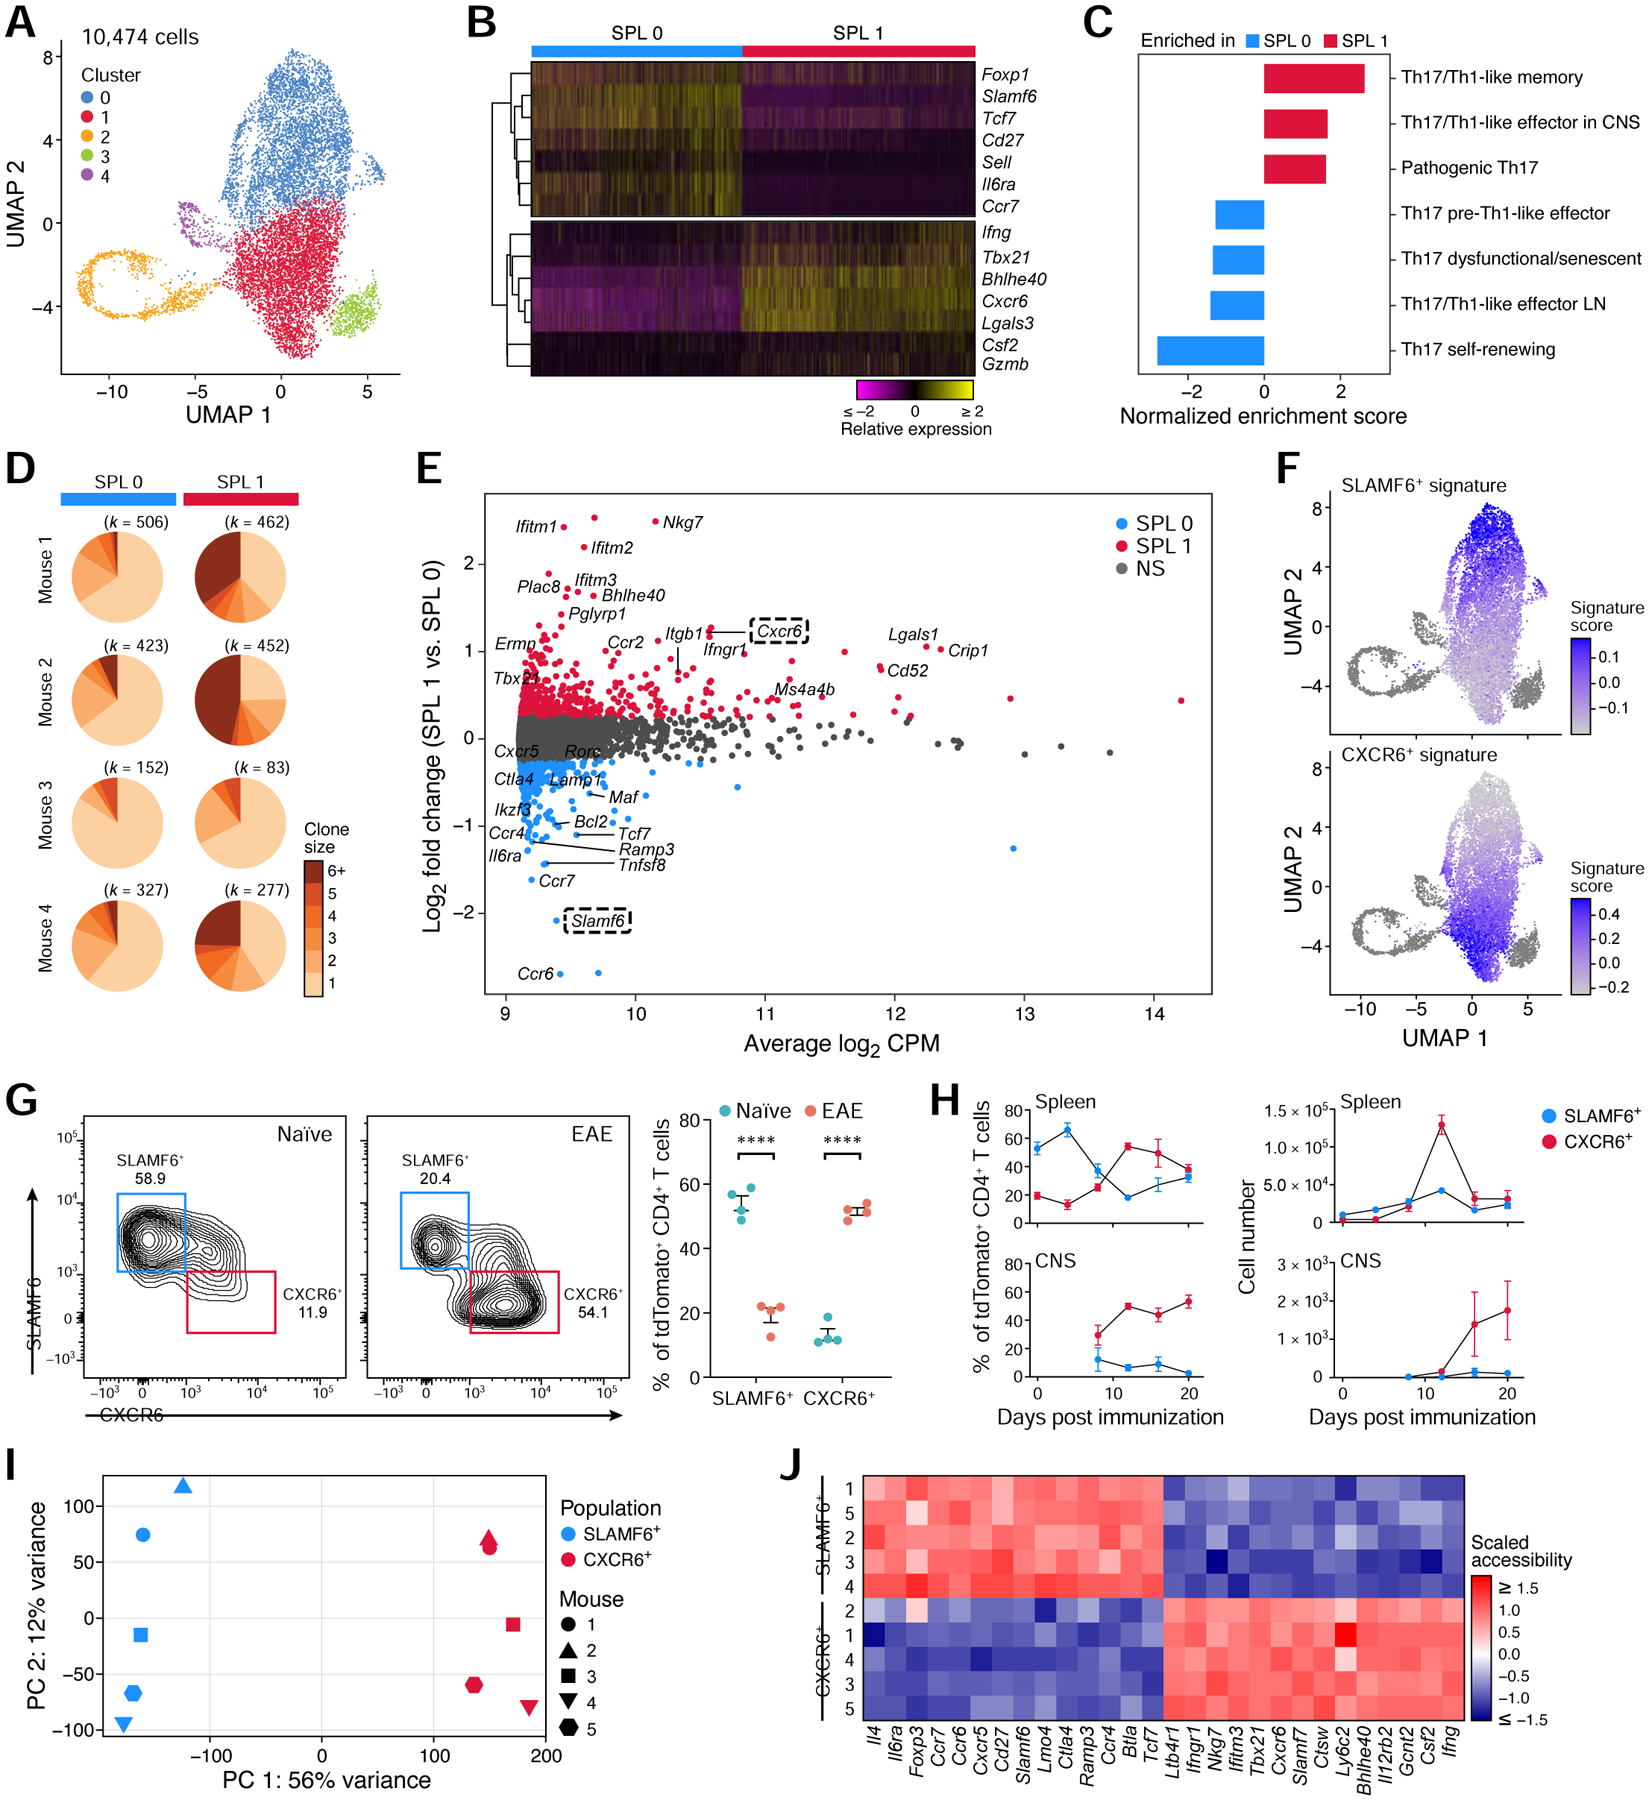
Figure 5: Discovery of a homeostatic and a pathogenic Th17 population in the spleen.

(A) UMAP of all splenic current (GFP+) and ex-Th17 cells (GFP−) during EAE.
(B) Relative expression of selected homeostatic and pathogenic genes that are differentially expressed (FDR <0.05) between SPL0 and SPL1.
(C) Gene set enrichment analysis of published Th17 pathway signatures (Lee et al., 2012, Gaublomme et al., 2015) in SPL1 vs. SPL0.
(D) Clonal expansion of SPL0 and SPL1 cells in each mouse. The number of cells is shown above. Clonal expansion scores are 0.018, 0.026, 0.016, and 0.022 for each mouse (1–4) in SPL0, and 0.071, 0.116, 0.024, and 0.080 in SPL1.
(E) MA plot of differentially expressed genes between SPL1 and SPL0 (FDR <0.05, fold change ≥1.5).
(F) Overlay of the bulk RNA-seq derived CXCR6+ and SLAMF6+ gene signatures (Table S4) on the splenic UMAP.
(G) Frequency of the CXCR6+ and SLAMF6+ spleen populations in naïve and EAE-diseased mice analyzed by flow cytometry (n=4). Representative flow cytometry plots (left) and quantification (right).
(H) Frequencies (left) and number (right) of SLAMF6+ and CXCR6+ cells in the spleen (top) and CNS (bottom) over the EAE disease time-course (n=3–4). CNS cells were sampled starting at day 8.
(I, J) ATAC-seq of the SLAMF6+ and CXCR6+ populations. (I) Scatter plot of samples based on the top two PCs. (J) Normalized chromatin accessibility for a selected list of genes from the bulk RNA-seq derived SLAMF6+ and CXCR6+ gene signatures.
