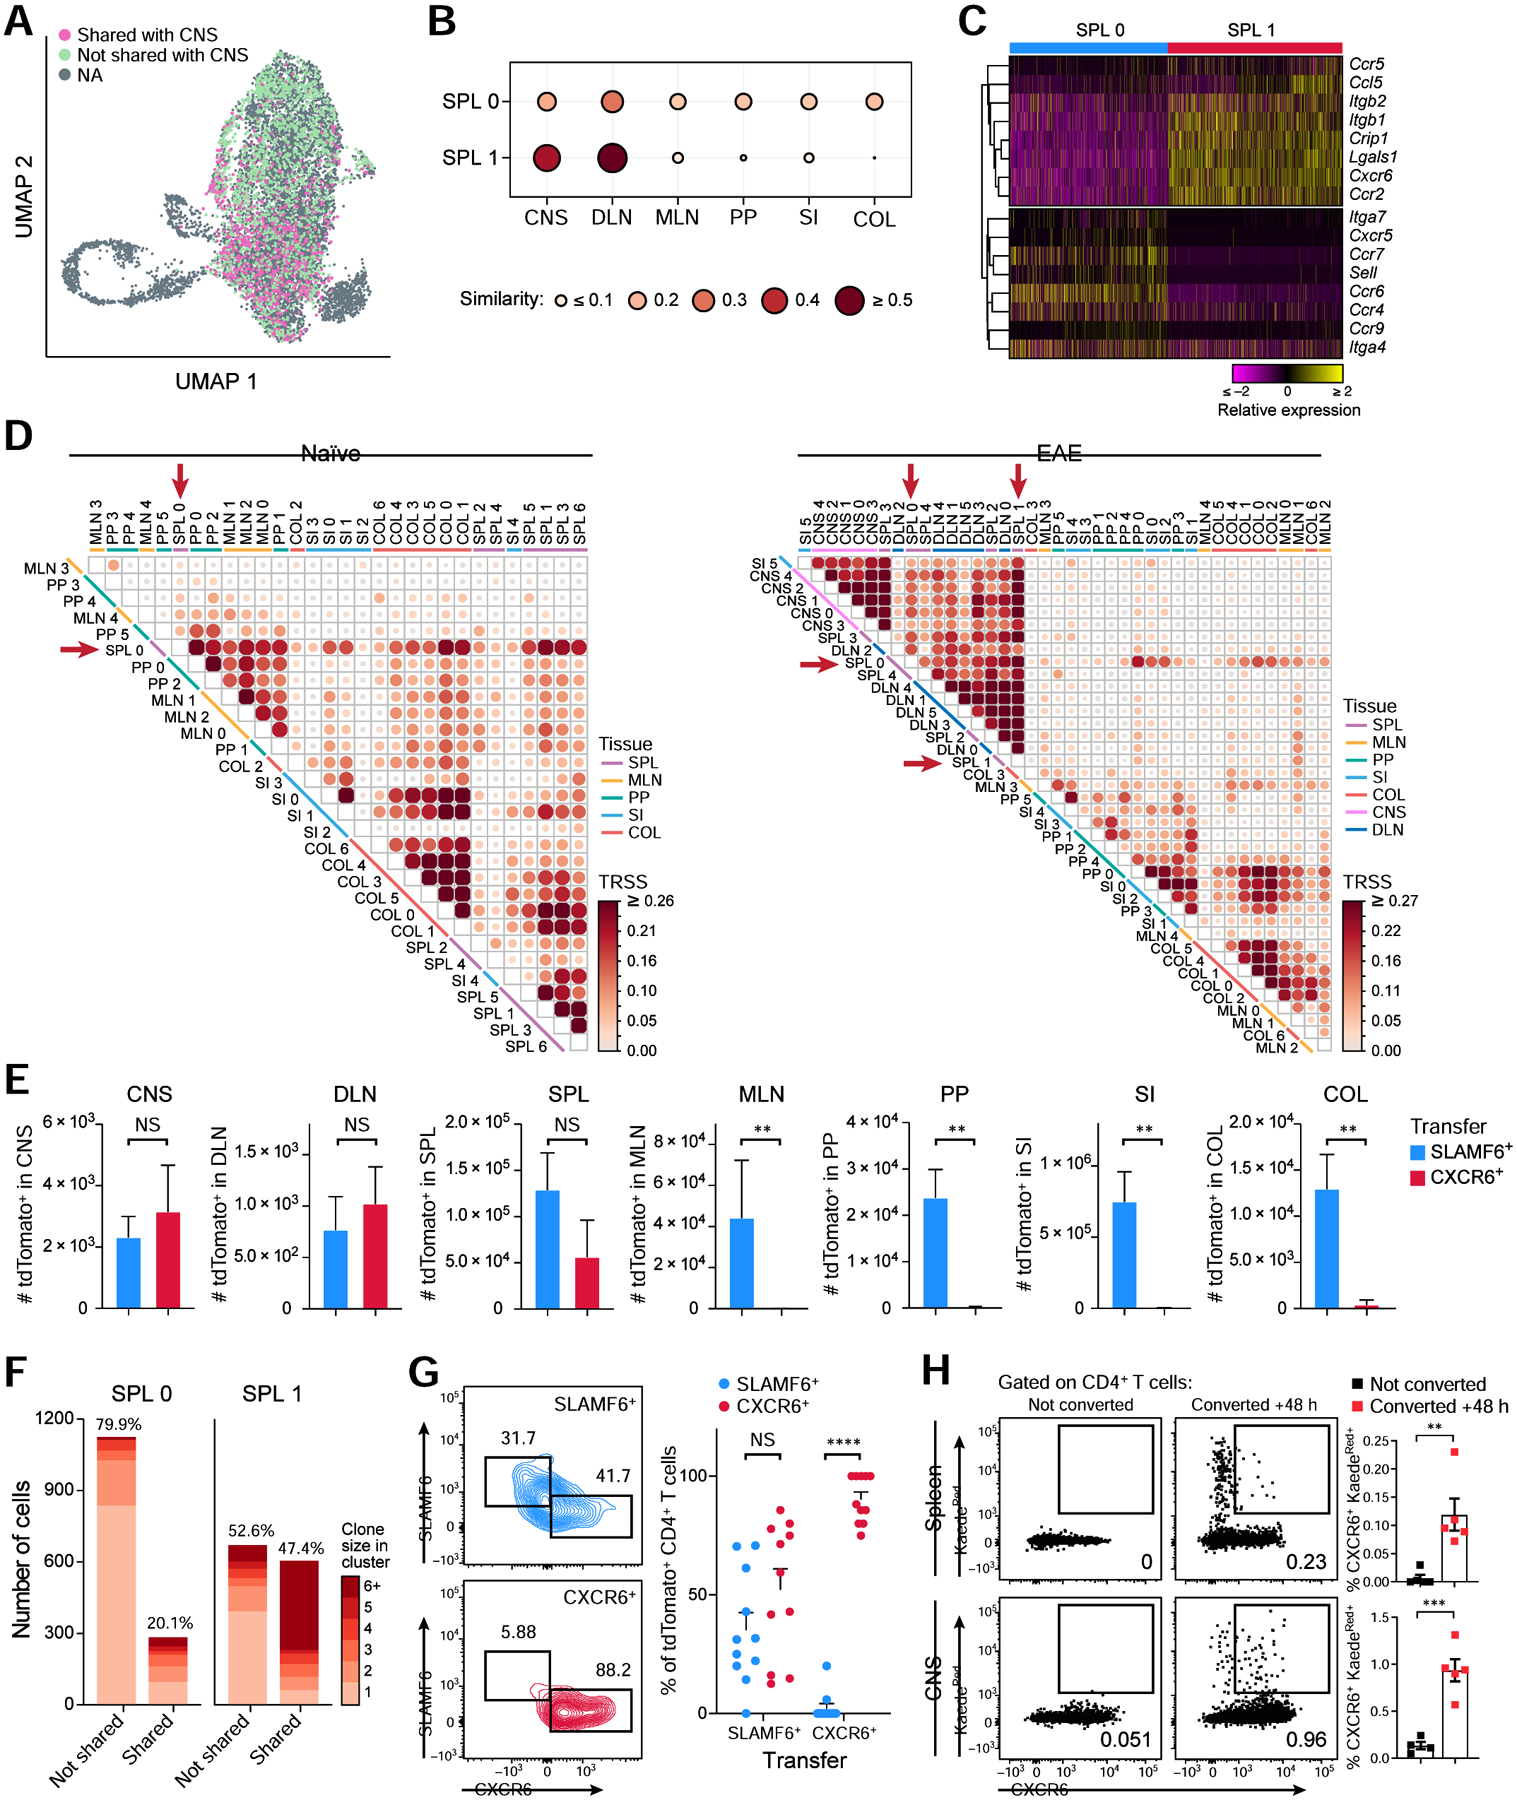
Figure 6: The homeostatic and pathogenic splenic Th17 populations display distinct migratory behavior in vivo.

(A) UMAP of the SPL0 and SPL1 cells colored by TCR sharing (pink) or not sharing (green) with Th17 cells in the CNS.
(B) TCR repertoire similarity analysis of SPL0 and SPL1 with cells in all other tissues.
(C) Relative expression of selected genes involved in immune cell trafficking that are differentially expressed (FDR <0.05) in clusters SPL0 and SPL1.
(D) TCR repertoire similarity analysis of intra-tissue clusters at homeostasis (left) and during EAE (right). Clusters were defined as in Figure 2A and Figure S6B.
(E) Cell numbers of tdTomato+ cells in each tissue following SLAMF6+ or CXCR6+ tdTomato+ cell transfer into EAE-bearing recipients (n=5). Two-tailed Mann Whitney test was performed.
(F) Number of cells in SPL0 and SPL1 whose TCRs were not shared (left) or shared (right) with the other cluster. Proportions are annotated on the top. Clonal expansion scores are 0.01 and 0.05 for not shared and shared clones in SPL0, and 0.03 and 0.10 in SPL1.
(G) SLAMF6 and CXCR6 expression on transferred tdTomato+ cells in the spleen. SLAMF6+ or CXCR6+ tdTomato+ cells were transferred into EAE-bearing recipient mice and spleens were harvested 7 days post transfer (n=11). Representative flow cytometry plots (left) and quantification (right) are shown.
(H) Frequencies of photoconverted KaedeRed+ CXCR6+ cells in the spleen (top) and CNS (bottom) of EAE-bearing mice 48 h after photoconversion of intestinal cells (n=4–5). See also Figures S6 and S7.
