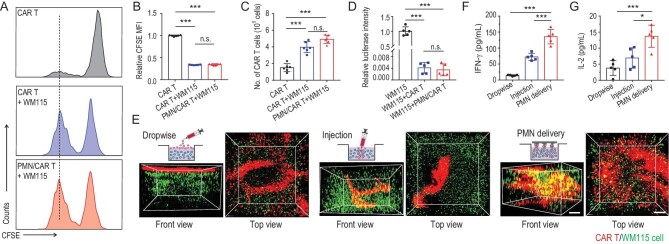
Figure 2.
PMN promotes CAR T cell infiltration in a 3D tumor model in vitro. (A) CSPG4+ CAR T cells labeled with CFSE were co-cultured for 3 days with CSPG4-expressing WM115 tumor cells. Representative flow cytometry histograms showing CFSE dilution are presented. (B) Relative mean fluorescence intensity of CFSE in (A), indicating T cell proliferation, n = 6. (C) Number of CAR T cells counted by flow cytometry after incubation with WM115 cells, n = 6. (D) CSPG4+ CAR T cells were co-cultured for 3 days with firefly luciferase labeled WM115 cells. Relative luciferase intensity after 3 days of culture is illustrated, n = 5. (E) Schematic of three approaches (dropwise, single-needle injection and PMN) used to deliver CAR T cells into a 3D tumor model in vitro. The 3D reconstruction illustrates CAR T cells and WM115 cell distribution in the 3D tumor model at day 3 after T cell seeding; scale bar: 300 μm. Measurement of human (F) IFN-γ and (G) IL-2 released by CAR T cells in the 3D tumor model at day 3, n = 5. Data are presented as mean ± s.d., and statistical significance was calculated via one-way ANOVA with a Tukey post-hoc test. P value: *P < 0.05, ***P < 0.001; n.s. means no significant difference.

