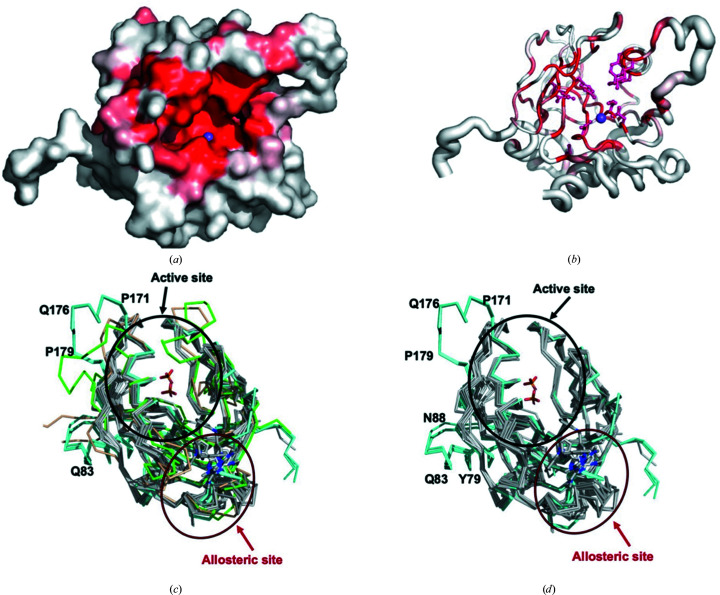
Figure 3.
Structural comparison of CtPPase with other PPases. (a) Solvent-accessible surface area colored by sequence conservation. Residues clustered in the active-site cleft are identified by the sodium ion present in the crystal structure of CtPPase (magenta sphere). (b) Coil diagram calculated by ENDscript. The circumference of the ribbon (sausage) represents the relative structural conservation compared with 41 other PPase structures (the same structures as indicated in Fig. 2 ▸). Thinner ribbons represent more conserved regions, while thicker ribbons represent less conserved regions. The ten identical residues cluster within or in proximity to the active site. Identical residues are indicated by red regions on the surface and a red ball-and-stick representation in ribbon diagrams. The sodium ion bound in the active site of each monomer is shown as a purple sphere. (c) Comparison of the active and allosteric sites of CtPPase (cyan) with bacterial PPases (gray) and eukaryotic PPases (Homo sapiens PPase, PDB entry 7btn, green; Plasmodium falciparum PPase, PDB entry 5wru, brown). (d) The same view of the structures without the eukaryotic PPases. The top ten unique bacterial PPases were selected from the ENDscript alignment. All three monomer chains of CtPPase are shown.

