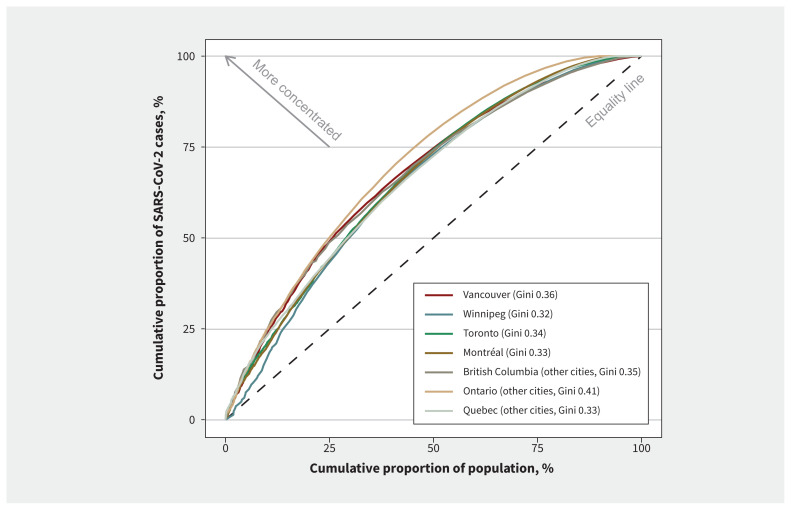
Figure 1:
Lorenz curves of the cumulative proportion of confirmed SARS-CoV-2 cases (excluding long-term care residents) by cumulative proportion of population in cities in British Columbia, Manitoba, Ontario and Quebec. The population was ranked by the number of cases in each dissemination area, from the highest to the lowest.

