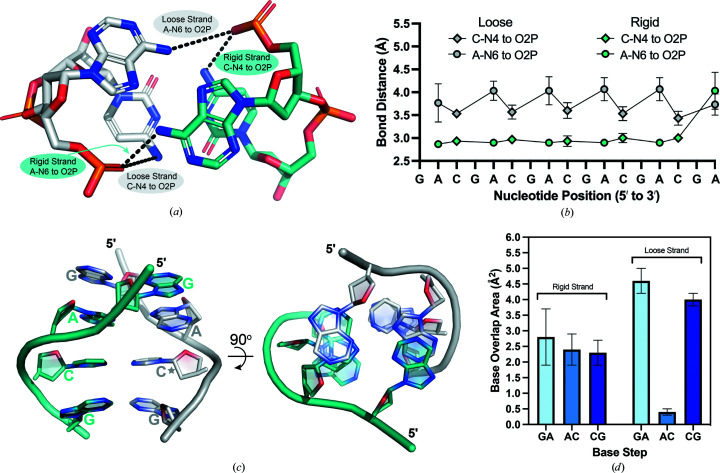
Figure 5.
Hydrogen-bond distances and base-overlap areas are used to distinguish loose and rigid strands within the d(CGA) ps-duplex. (a) The A/C step highlighting the A-N6 to O2P and C-N4 to O2P interactions within loose (gray) and rigid (teal) strands. Chain A (duplexes 1 and 4), chain C (duplex 2) and chain E (duplex 3) have been characterized as loose strands. Chain B (duplexes 1 and 4), chain D (duplex 2) and chain F (duplex 3) have been characterized as rigid strands. (b) Loose (gray) and rigid (teal) strand bond distances represented along the GA(CGA)5 sequence. A-N6 to O2P distances are plotted as circles and C-N4 to O2P distances are plotted as diamonds. Each data point represents the average distance measured from duplexes 1 to 3. Loose-strand bond distances cycle between 3.5 ± 0.1 and 4.1 ± 0.1 Å depending on the identity of the nucleotide involved in the interaction, while rigid-strand bond distances remain between 2.8 and 3.1 Å regardless of the interaction. (c) Base-overlap areas are different for loose and rigid strands. View of all unique base-stacking interactions (inter-strand G/A, intra-strand A/C and intra-strand C/G) that contribute to d(CGA) triplet stabilization. The 90° rotation illustrates the difference in stacking-overlap area between strands. The rigid strand (teal) maintains consistent stacking-overlap areas, while the loose strand (gray) is highly variable. The star denotes the cytosine that is extended from the helical axis. (d) Base-stack overlap areas are represented as averages of overlap areas from d(CGA) triplets from duplexes 1 to 4 and are shown for the respective base steps.

