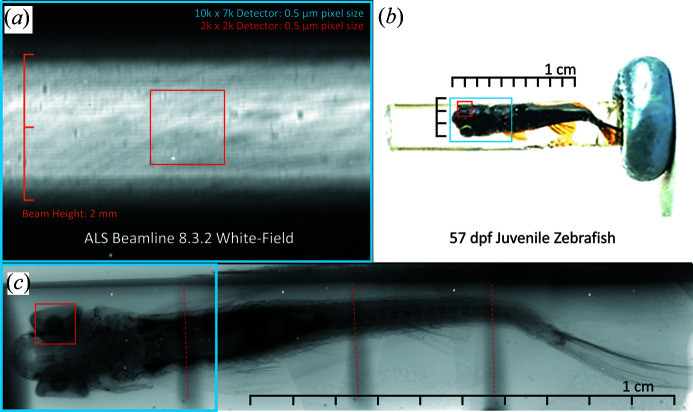
Figure 2.
Field-of-view characterization utilizing the ALS synchrotron beam and large-scale biological sample. The entirety of the beam height at the ALS 8.3.2 beamline is encapsulated by the detector’s field of view while maintaining 0.5 µm pixel size (a). A 2000 × 2000 pixel field of view at the same 0.5 µm pixel size is shown in red. To illustrate the field of view in a more biologically applicable and practical sense, we present a cm-scale, juvenile, 57 day post-fertilization (d.p.f.) zebrafish embedded in resin and stained with phosphotungstic acid (PTA) (b) using a local NOVA 96000 tungsten filament source to demonstrate field of view (c), with coverage of the same 2000 × 2000 pixel array in red and our detector’s field of view in blue. Rotating the camera by 90° makes it possible to scan in a single view horizontally and to stitch in four sections vertically, compared with approximately 500 scans on a 2000 × 2000 detector to cover the same volume. Red dotted lines indicate areas of field-of-view overlap.

