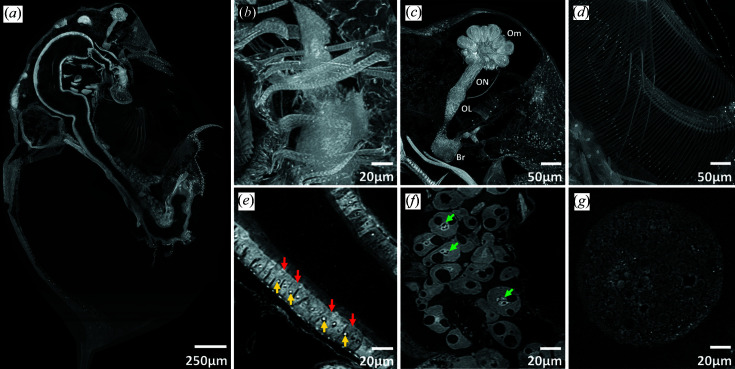
Figure 6.
Adult D. magna stained with PTA showing sub-cellular resolution for different cell types and structures (a). Cell types and structures that can be visualized by customizing various stack thicknesses included: muscle striations (about 2 µm) on the labral muscles (b), ommatidia (Om), optic nerves (ON), optic lobe (OL) and brain (Br) (c), setae of the filter plates (d), nucleoli (yellow arrows, ∼2 µm diameter) in the gut epithelial cells (red arrows) (e), nucleoli (green arrows) in the fat cells (f) and yolk globules (g) in a developing embryo. Panels (a) to (c) were generated from maximum intensity projections (MIP) of 50 slices, panel (d) from an MIP of 100 slices to visualize thicker three-dimensional structures and panels (e) to (g) from an MIP of ten slices. An MIP of ten slices is equivalent to a 5 µm-thick histology slide.

