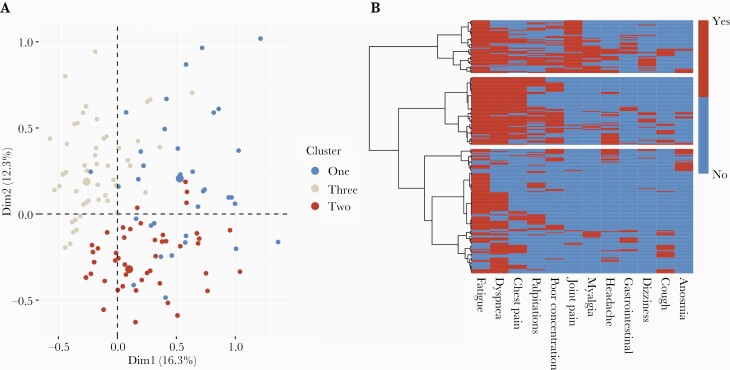
Figure 2.
Multiple correspondence analysis (MCA) and hierarchical clustering of symptoms in individuals presenting with prolonged recovery from coronavirus disease 2019 (long COVID). A, MCA factor map showing individual coordinates used to generate the dendrogram. B, Heatmap showing the symptoms present in individuals within clusters. Compared to cluster 3 (bottom bar), cluster 1 (top bar) demonstrates musculoskeletal and pain symptoms, and cluster 2 (middle bar) shows cardiorespiratory symptoms. Abbreviations: Dim1, dimension 1; Dim2, dimension 2.

