Figure 1.
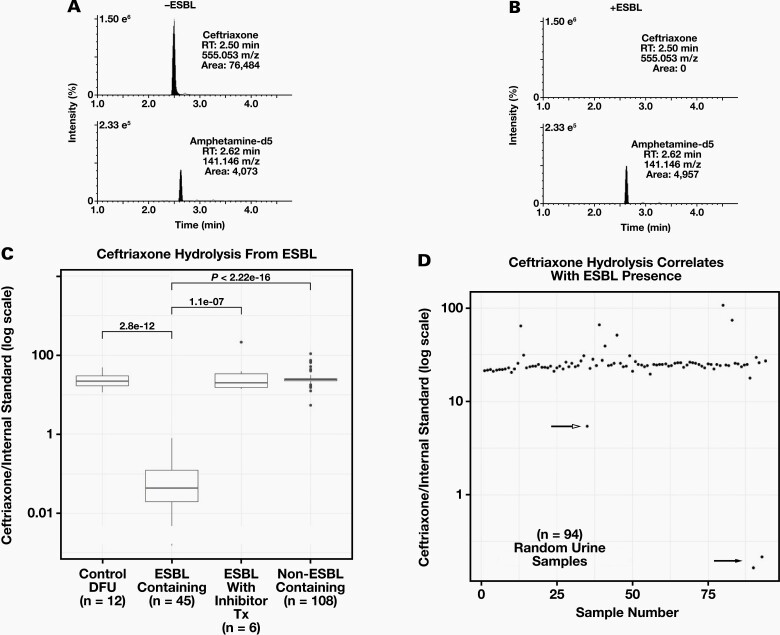
Evaluation of ESBL Hydrolysis of Ceftriaxone: (A) EICs of the protonated molecular ions (exact m/z) of ceftriaxone (top) and IS (bottom) after 4 hours of incubation with a sample not containing an extended spectrum beta lactamase (-ESBL) expressing pathogen. (B) EICs of the protonated molecular ions of ceftriaxone (top) and IS (bottom) after 4 hours of incubation with an ESBL containing specimen (+ESBL). Expected retention times for each compound are indicated to illustrate the loss of a peak. % ion intensity (indicated at top left of each EIC) is plotted on the Y-axis and Time (min) is plotted on the X-axis. (C) Boxplots of median ratios of ceftriaxone/IS after incubation with: Control DFU –drug free urine (n = 12), ESBL containing urine specimens (n = 45), ESBL containing urine specimens from patients receiving beta-lactamase inhibitor treatment (n = 6), and non-ESBL containing specimens (n = 108). Wilcoxon P-values are displayed. (D) Scatterplot illustrating ratios of ceftriaxone/IS plotted on log scale for 94 random urine culture specimens after incubation. Closed arrow indicates two samples with ESBL identified by urine culture and susceptibility assays. Open arrow indicates a non-ESBL containing specimen.

