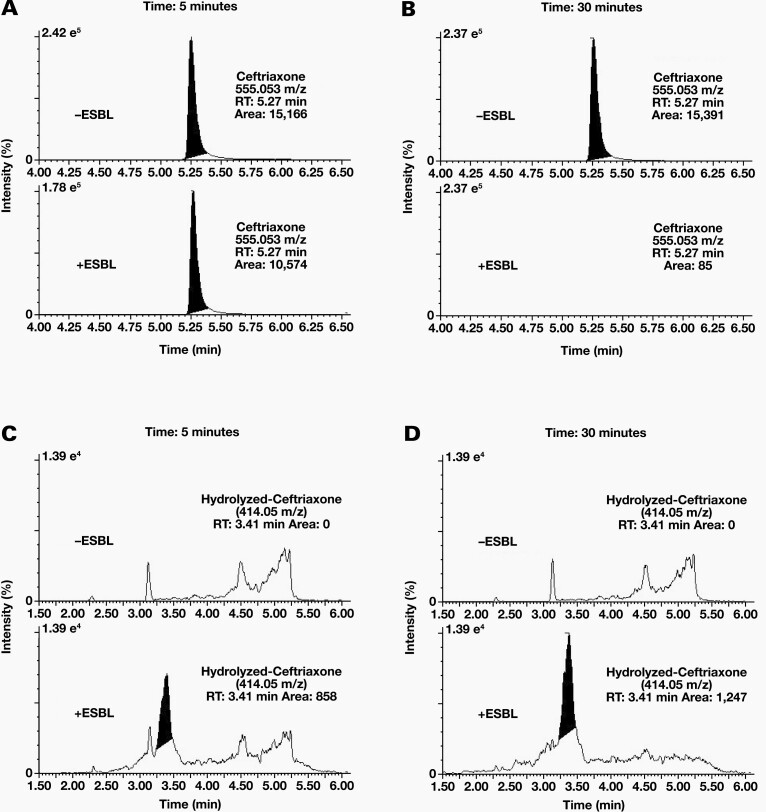
Figure 4.
Kinetics of Ceftriaxone Hydrolysis: Peak intensity of ceftriaxone after 5 minutes (A) and 30 minutes (B) of incubation with (+ESBL) or without (-ESBL) an ESBL containing specimen. The predicted hydrolysis product due to the loss of the ceftriaxone’s triazine-ylthiol group at 414.05 m/z (RT: 3.40 min) appears after 5 minutes (C) and 30 minutes (D) of incubation only in the presence of ESBL expressing bacteria. % ion intensity (indicated at top left of each EIC) is plotted on the Y-axis and Time (min) is plotted on the X-axis.

