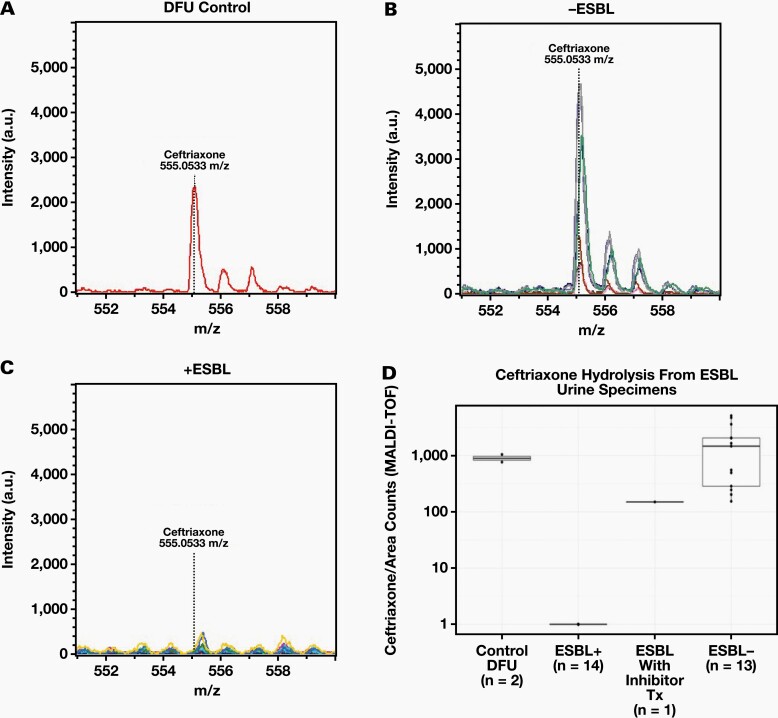
Figure 5.
Evaluation of Ceftriaxone hydrolysis by MALDI-TOF MS. Protonated molecular ion of ceftriaxone after incubation with DFU (n = 2) (A), patient specimens (n = 8) without an ESBL (B), and patient specimens with an ESBL (n = 14) (C). The expected m/z of the protonated ceftriaxone molecular ion (555.0533 m/z) is indicated in each plot with a dotted line and each plot is shown using the same X and Y axis scale. (D) Box plots of the median area counts of ceftriaxone after incubation with DFU, ESBL +, ESBL + w/Inhibitor Treatment, and ESBL – specimens as measured by MALDI-TOF MS. Whiskers are up to but no greater than 1.5 times the inter-quartile range.

