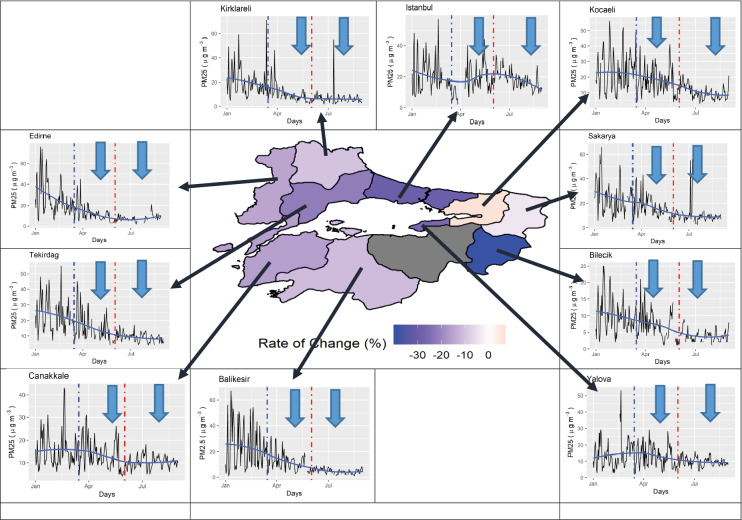
Fig. 4.
(a) Time series located outer of the graph, represent the daily mean PM2.5 concentrations for the period of January 1–August 31, 2020. (b) Inner map represents the change of mean PM2.5 concentrations during LDM with respect to mean PM2.5 concentrations of the same period of the previous year.

