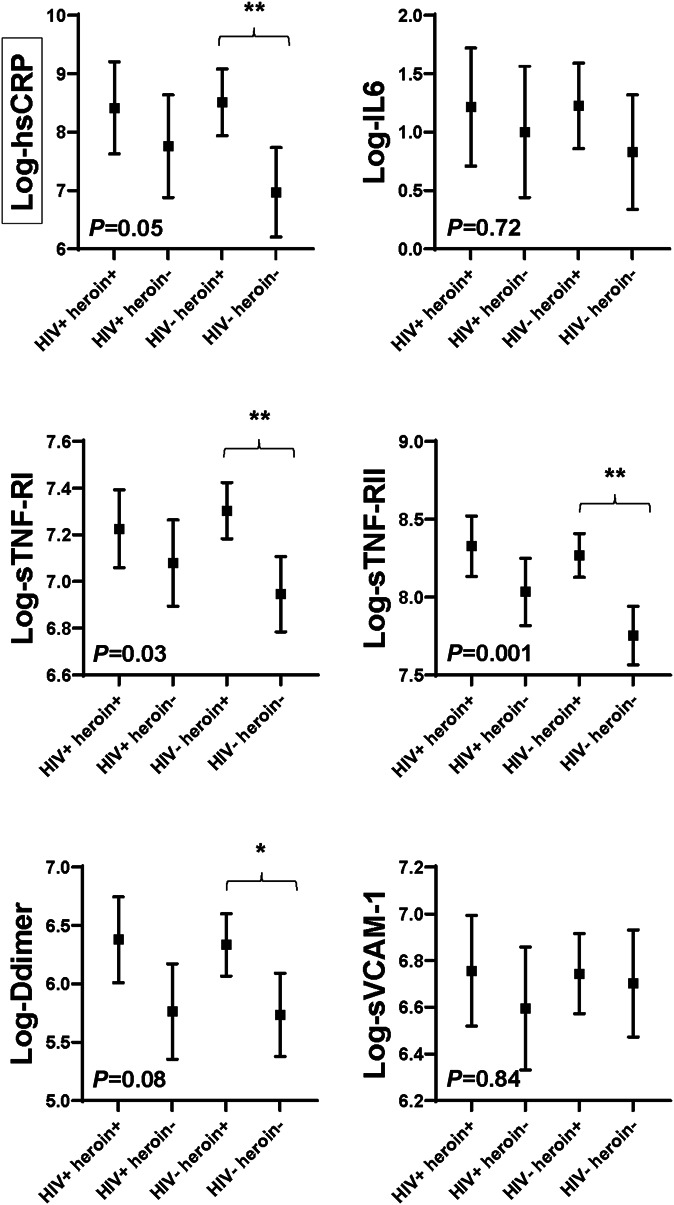
FIGURE 2.

Systemic and vascular inflammation markers by group. Symbols represent adjusted least square means for each marker by group. Means are adjusted for age, sex, race, trunk fat, smoking, and hepatitis C status. Error bars show 95% confidence interval around the mean values. P < 0.05 indicates there are differences between the mean values among groups. **P < 0.01 between groups; *P < 0.05 between groups. Black boxes surrounding a y axis variable indicate that there is effect modification by HIV status for this marker, that is, P < 0.15 for heroin use-by-HIV status interaction term. hsCRP, high-sensitivity C-reactive protein; IL-6, interleukin-6; sTNF-α-RI and sTNF-α-RII, soluble tumor necrosis factor-α receptor I and receptor II; sVCAM-1, soluble vascular cell adhesion molecule-1.
