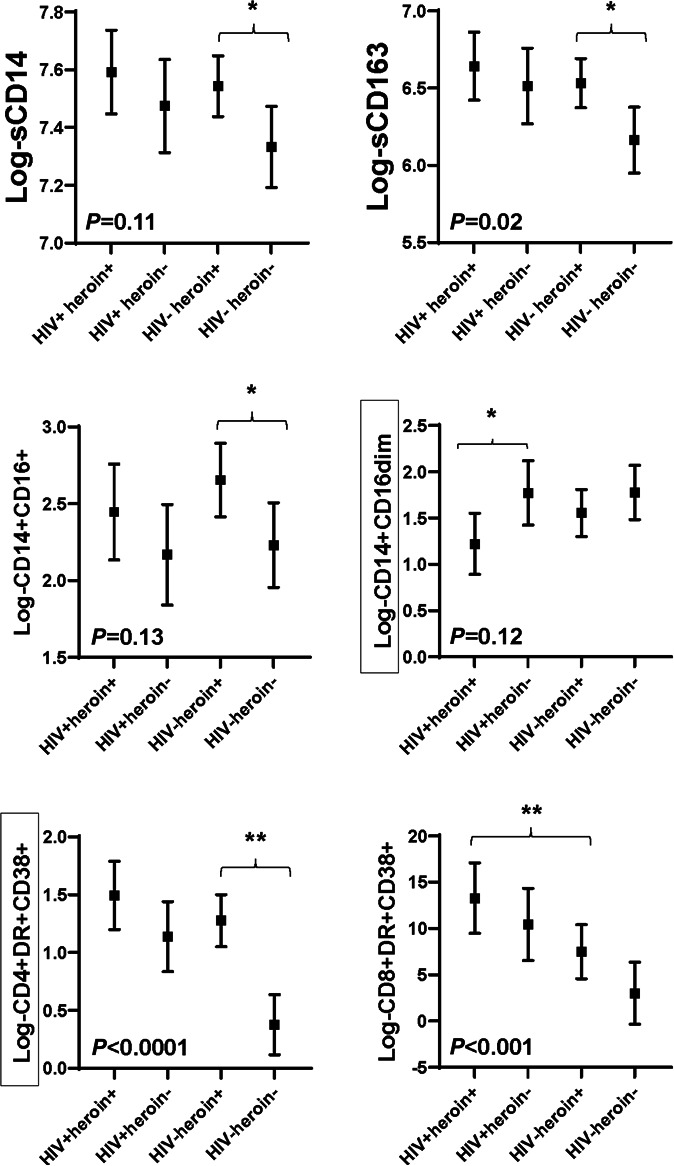
FIGURE 3.

Soluble and cellular markers of monocyte and T-cell activation by group. Symbols represent adjusted least square means for each marker by group. The mean values are adjusted for age, sex, race, trunk fat, smoking, and hepatitis C status. Error bars show 95% confidence interval around the mean values. P < 0.05 indicates there are differences between the mean values among groups. **P < 0.01 between groups; *P < 0.05 between groups. Black boxes surrounding a y axis variable indicate that there is effect modification by HIV status for this marker, that is, P < 0.15 for heroin use-by-HIV status interaction term. sCD14, soluble CD14; sCD163, soluble CD163.
