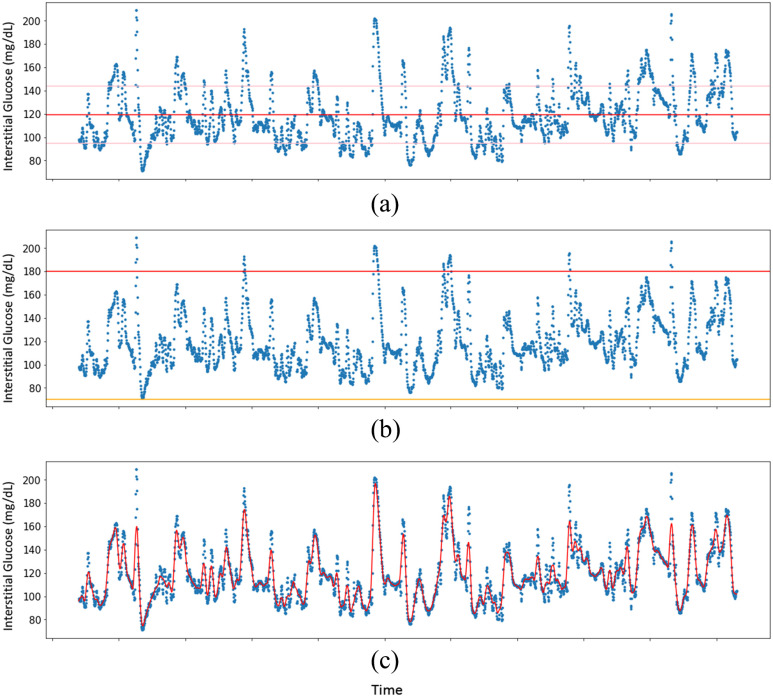
FIGURE 1.
Visualizing longitudinal CGM data with the cgmquantify Python package. Shown are a visualization with indicators of the mean interstitial glucose level (red) and 1 SD from the mean (pink) (a), a visualization with indicators of hyperglycemic (>180 mg/dL glucose, red) and hypoglycemic (<70 mg/dL glucose, yellow) (b), and a plot with LOWESS smoothing of the glucose data (c).

