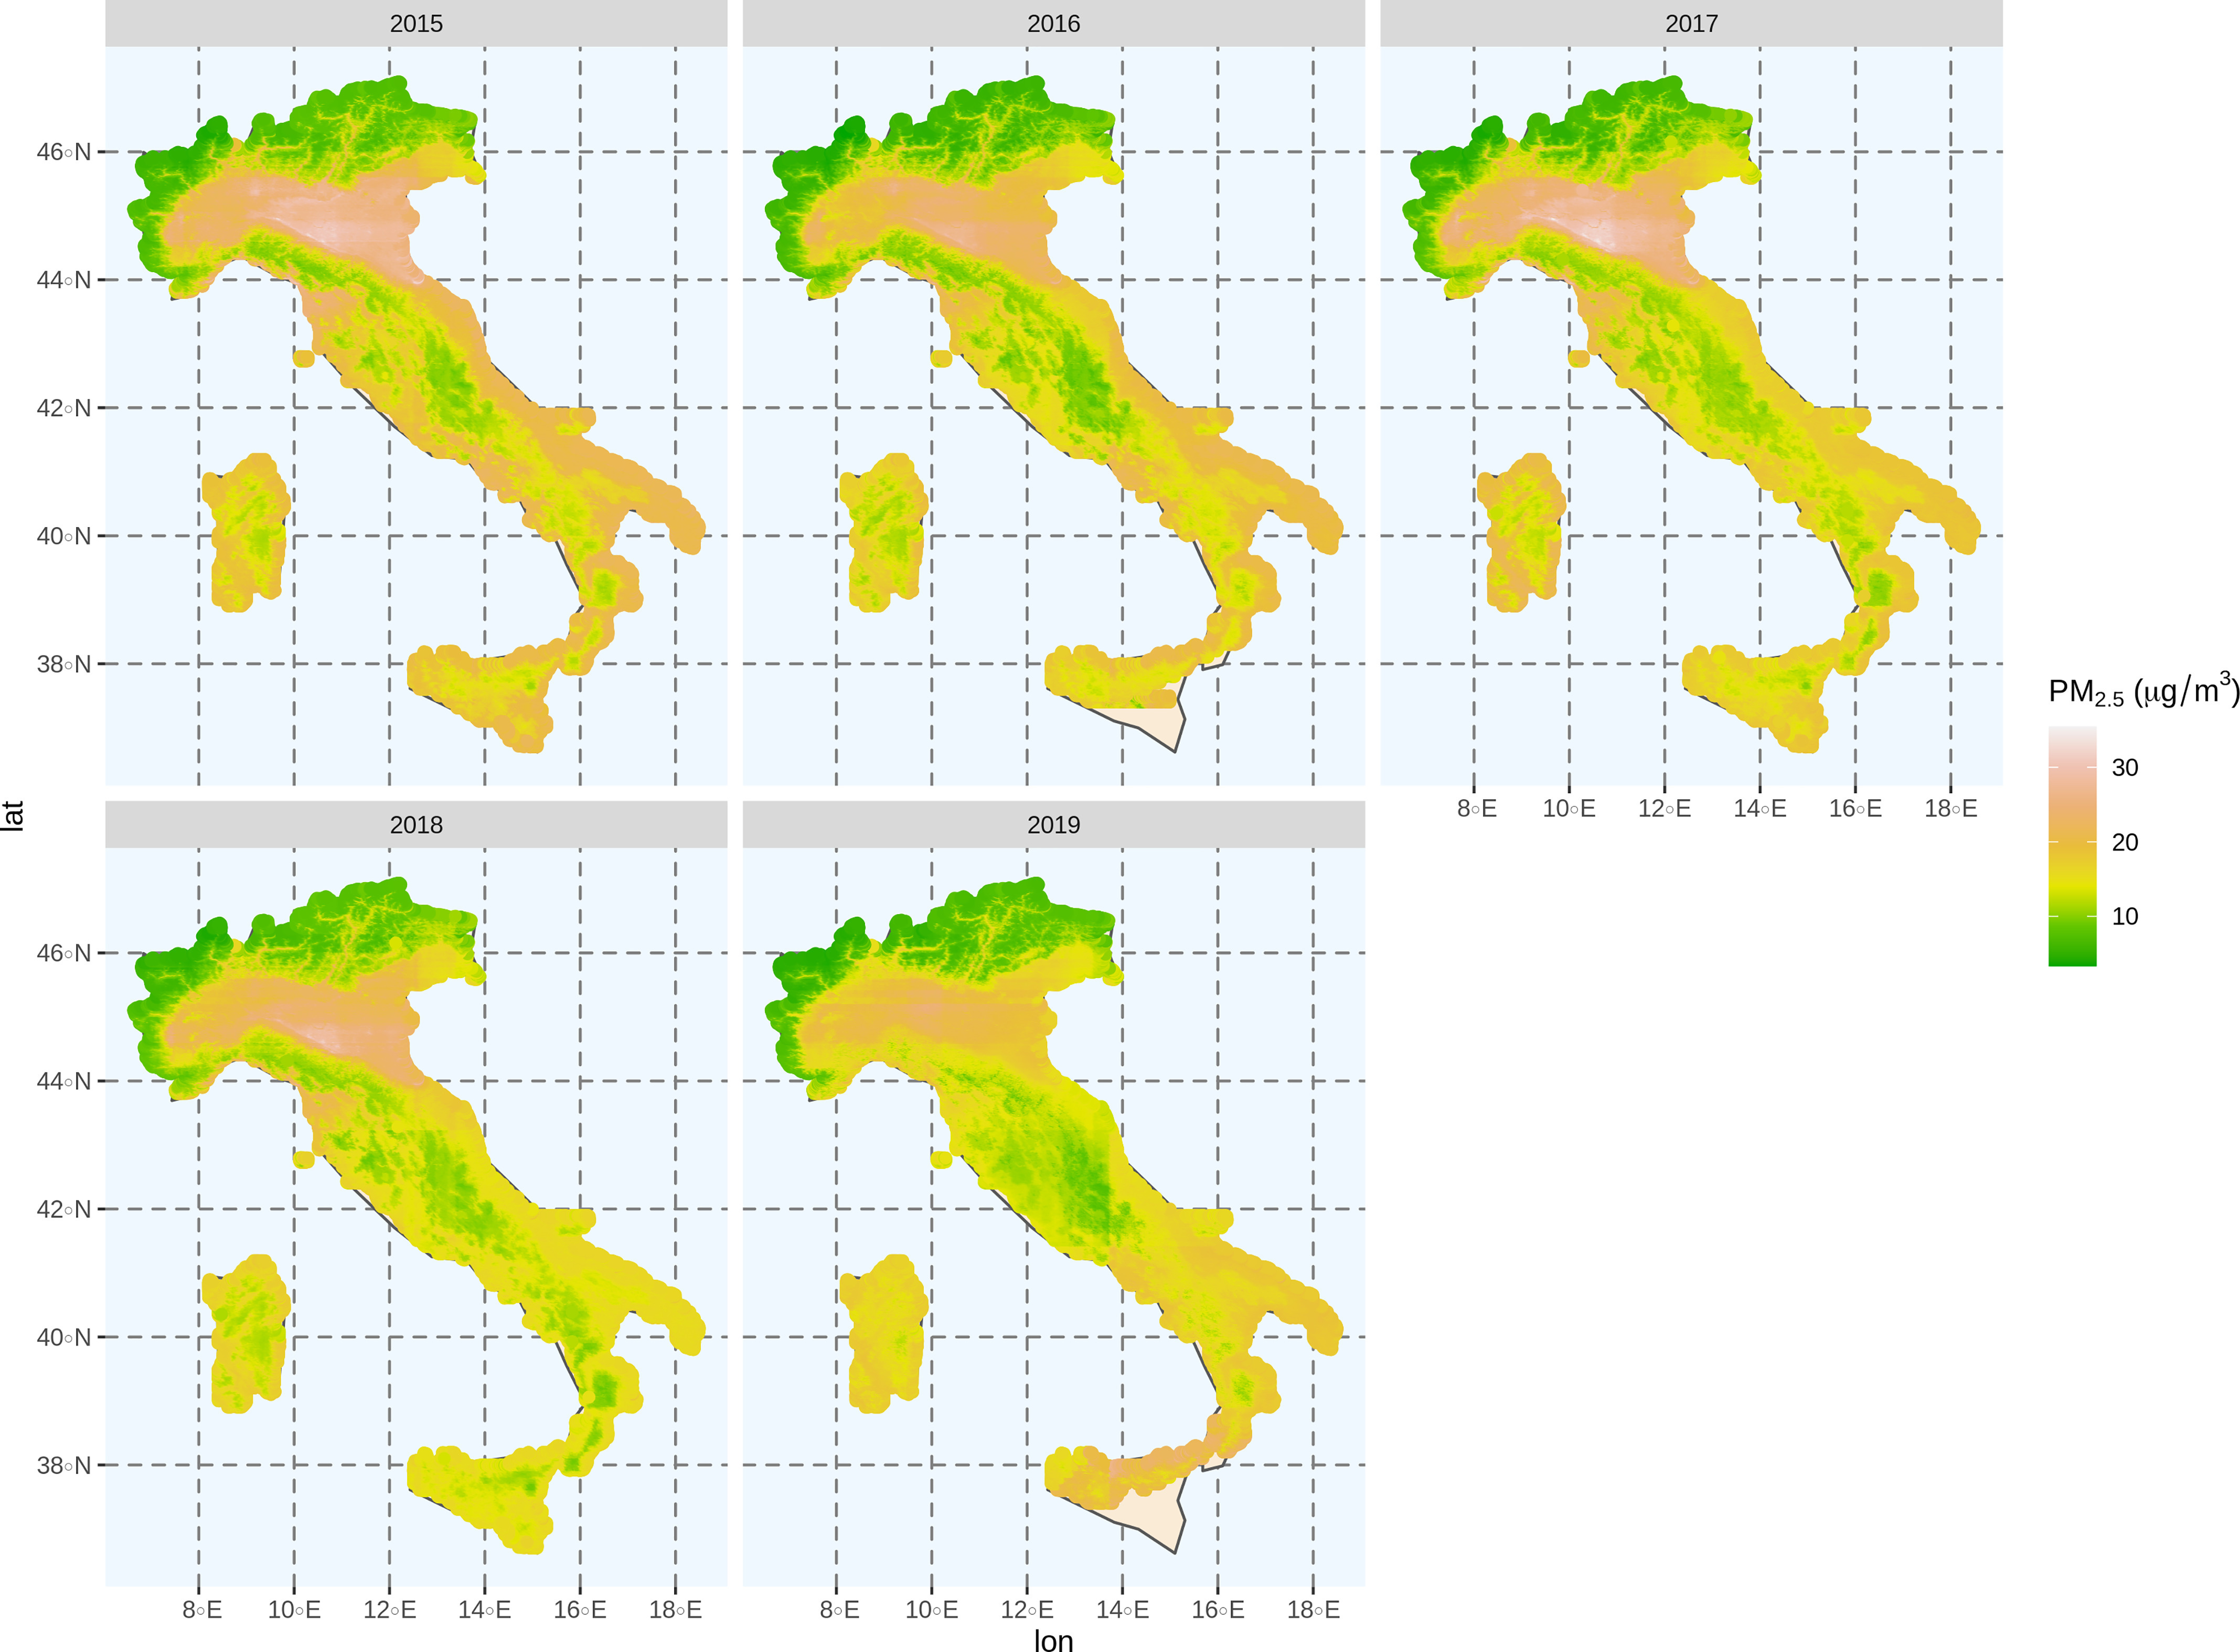
Figure 3.

The estimated annual average concentrations of particulate matter with an aerodynamic diameter () (micrograms per cubic meter) from 2015 to 2019 in Italy at spatial resolution.

The estimated annual average concentrations of particulate matter with an aerodynamic diameter () (micrograms per cubic meter) from 2015 to 2019 in Italy at spatial resolution.