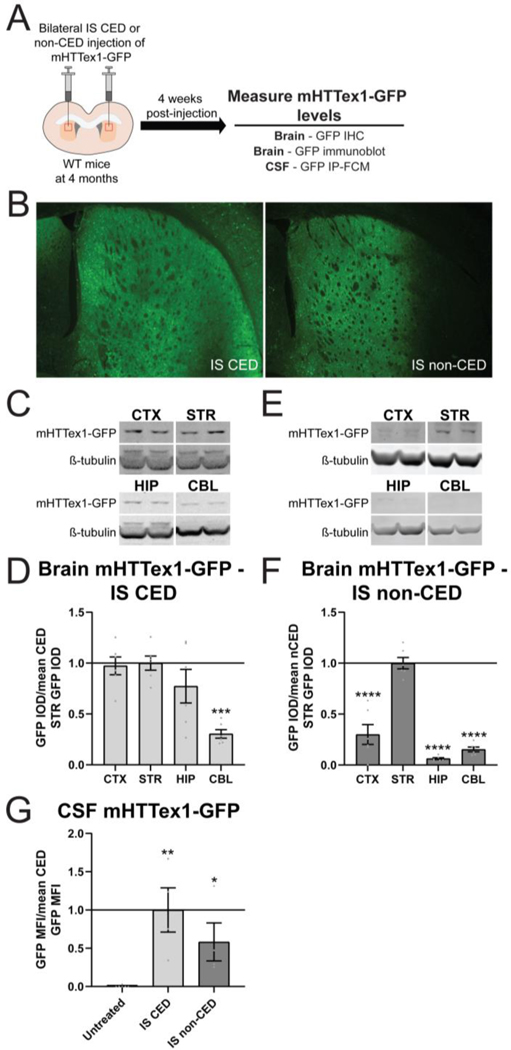
Figure 1. Lentiviral delivery of mHTTex1-GFP restricted to the striatum results in detectable fusion protein in the CSF.
A) Graphical experimental overview where 4 month old wild type (WT) mice received bilateral intrastriatal (IS) injections with mHTTex1-GFP lentivirus via either convection enhanced delivery (CED) or non-CED. Four weeks later, brains were collected for immunohistochemistry (IHC) and immunoblot to evaluate mHTTex1-GFP distribution and CSF was collected to measure fusion protein levels by GFP IP-FCM. B) IHC on brains injected with mHTTex1-GFP lentivirus shows broad forebrain expression following CED or restricted striatal expression following non-CED. C) Representative immunoblots (probed with GFP antibody, A-11122) of the cortex (CTX), striatum (STR), hippocampus (HIP) and cerebellum (CBL) from 5 month old WT mice following bilateral IS CED injections of mHTTex1-GFP. D) Relative quantification of mHTTex1-GFP levels in the brain 4 weeks after IS CED injection of mHTTex1-GFP shows broad distribution of the fusion protein (N=6. One-way ANOVA: p=0.0003. Tukey’s multiple comparison test: ***p=0.0005 compared to STR). E) Representative immunoblots of the CTX, STR, HIP and CBL from 5 month old WT mice following bilateral IS non-CED injections of mHTTex1-GFP. F) Relative quantification of mHTTex1-GFP levels in the brain 4 weeks after IS non-CED injection of mHTTex1-GFP shows distribution of fusion protein is predominantly restricted to the STR (N=6. One-way ANOVA: p<0.0001. Tukey’s multiple comparison test: ****p<0.0001 compared to STR). G) Relative quantification of mHTTex1-GFP CSF normalized to mean CED GFP MFI shows that in comparison to untreated mice, the fusion protein is detected in the CSF following both broad CED and striatum restricted non-CED (N=6 for untreated, N=4 for IS CED and IS non-CED. One-way ANOVA p= 0.0078. Tukey’s multiple comparison test: IS CED **p=0.0026, IS non-CED *p=0.0463 compared to untreated).

