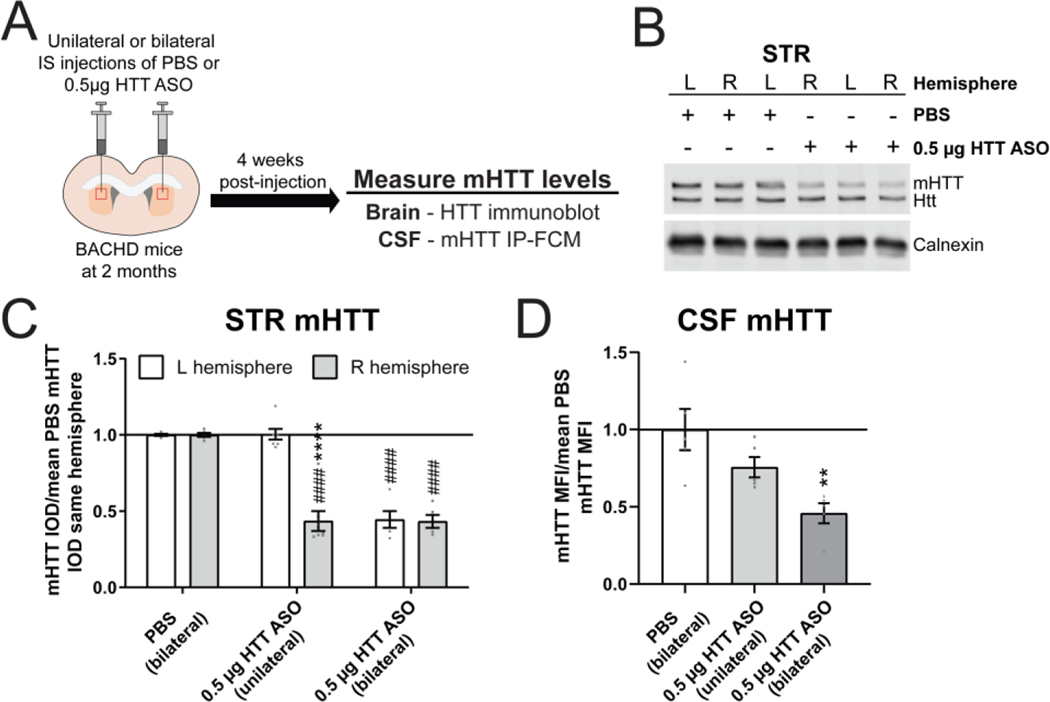
Figure 3. Localized mHTT lowering restricted to the striatum leads to a reduction of CSF mHTT.
A) Graphical experimental overview where 2 month old BACHD animals received either unilateral or bilateral IS injections with either PBS or 0.5 μg HTT ASO. Four weeks after IS injections, treated animals were harvested and mHTT levels in the STR and CSF were quantified. B) Representative immunoblot and C) relative quantification of mHTT levels in both STR hemispheres following unilateral (right hemisphere only) or bilateral IS injections with either PBS or 0.5 μg HTT ASO (N=5 for PBS, N=7 for unilateral 0.5 μg HTT ASO, N=5 for bilateral 0.5 μg HTT ASO. Two-way ANOVA: treatment p<0.0001, hemisphere p<0.0001 and interaction p<0.0001. Sidak’s multiple comparison test: unilateral HTT ASO L vs R hemisphere ****p<0.0001, bilateral 0.5 μg HTT ASO L vs R hemisphere p=0.9966, PBS R hemisphere vs unilateral 0.5 μg HTT ASO R hemisphere ####p<0.0001, PBS L hemisphere vs unilateral 0.5 μg HTT ASO L hemisphere p=0.9976, PBS R hemisphere vs bilateral 0.5 μg HTT ASO R hemisphere ####p<0.0001, PBS L hemisphere vs bilateral HTT 0.5 μg ASO L hemisphere ####p<0.0001). D) Relative quantification of mHTT levels in the CSF normalized to the mean of PBS mHTT median fluorescence intensity (MFI) shows an additive reduction of CSF mHTT with bilateral compared to unilateral IS injection of 0.5 μg HTT ASO, highlighting the proportionate contribution of both STR hemispheres to CSF mHTT (N=5 for each treatment condition. One-way ANOVA: p=0.0053. Tukey’s multiple comparison test: compared to PBS treated **p=0.0040 bilateral, p=0.2011 unilateral 0.5μg HTT ASO). IS = intrastriatal, L = left, R = right, CTX = cortex, STR = striatum, HIP = hippocampus, CBL = cerebellum, CSF = cerebrospinal fluid, IOD = integrated optical density.

