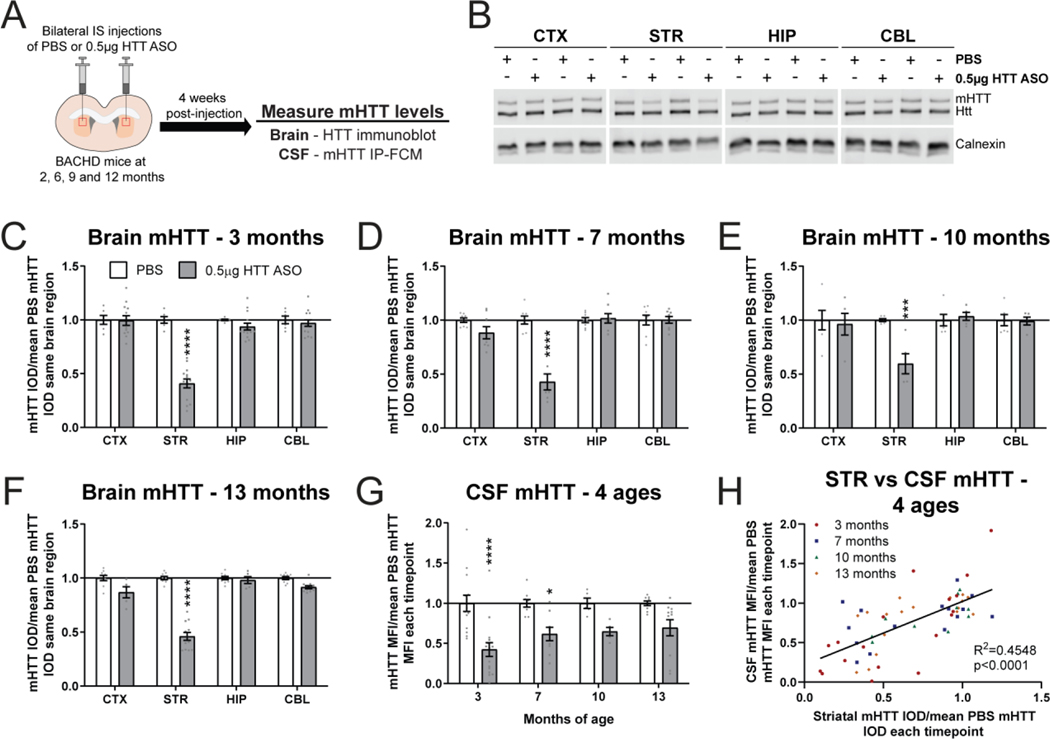
Figure 5. Selective mHTT lowering in the striatum at multiple ages correlates with a reduction of CSF mHTT.
A) Graphical experimental overview where 2, 6, 9 and 12 month BACHD animals received bilateral IS injections of either PBS or 0.5μg HTT ASO. Four weeks after IS injections, treated animals were harvested and mHTT levels in the brain and CSF were quantified at 3, 7, 10 and 13 months, respectively. B) Representative immunoblot of HTT in the CTX, STR, HIP and CBL of 13 month old BACHD mice following bilateral IS injections with either PBS or 0.5μg HTT ASO. Relative quantification of mHTT in different brain regions of C) 3 month (N=6 for PBS, N=14 for 0.5 μg HTT ASO. Two-way ANOVA: treatment p<0.0001, brain region p<0.0001, interaction p<0.0001. Sidak’s multiple comparison test: ****p<0.0001), D) 7 month (N=8 for PBS, N=8 for 0.5 μg HTT ASO. Two-way ANOVA: treatment p<0.0001, brain region p<0.0001, interaction p<0.0001. Sidak’s multiple comparison test: ****p<0.0001), E) 10 month (N=6 for PBS, N=5 for 0.5 μg HTT ASO. Two-way ANOVA: treatment p=0.0313, brain region p=0.0067, interaction p=0.0067. Sidak’s multiple comparison test: ***p=0.0004), and F) 13 month old treated BACHD animals (N=9 for PBS, N=6–12 for 0.5 μg HTT ASO. Two-way ANOVA: treatment p<0.0001, brain region p<0.0001, interaction p<0.0001. Sidak’s multiple comparison test: ****p<0.0001) shows consistent mHTT lowering restricted to the striatum. G) Relative quantification of mHTT in the CSF normalized to the mean of PBS mHTT MFI at each timepoint shows a significant reduction of CSF mHTT following bilateral IS with 0.5μg HTT ASO at 3 and 7 months but not at 10 and 13 months of age (N=5–14 for PBS, N=5–16 for 0.5 μg HTT ASO per age. Two-way ANOVA: treatment p<0.0001, age p=0.3541, interaction p=0.3541. Sidak’s multiple comparison test: 3 months ****p<0.0001, 7 months *p=0.0207, 10 months p=0.1908 and 13 months p=0.0726 0.5μg HTT ASO compared to PBS; Test for linear trend: HTT ASO p=0.0269). H) Comparison of STR mHTT and CSF mHTT levels at all ages following bilateral IS injections with either PBS or 0.5μg HTT ASO (Linear regression: R2=0.4548, p<0.0001). IS = intrastriatal, CTX = cortex, STR = striatum, HIP = hippocampus, CBL = cerebellum, CSF = cerebrospinal fluid, IOD = integrated optical density, MFI = median fluorescence intensity.

