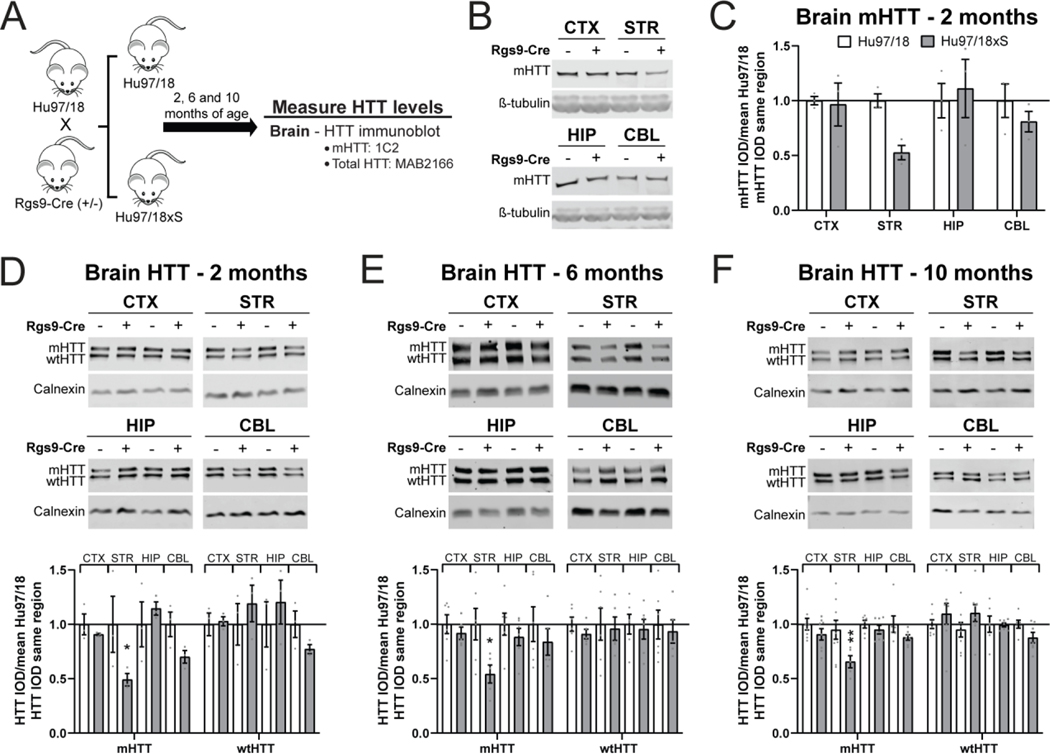
Figure 6. Rgs9-cre selectively inactivates mHTT in the striatum of Hu97/18 mice.
A) Graphical experimental overview where the Hu97/18 line was crossed to the Rgs9-Cre line to produce Hu97/18;Rgs9-Cre (−/−) (Hu97/18) and Hu97/18;Rgs9-Cre (+/−) (Hu97/18xS) littermates. Animals were collected at 2, 6 and 10 months of age for measurement of HTT in the brain. B) Representative immunoblots probed with the 1C2 antibody, raised against expanded polyglutamine, and C) relative quantification of mHTT levels in the CTX, STR, HIP and CBL of Hu97/18 and Hu97/18xS littermates at 2 months of age (N=3 per genotype. Two-way ANOVA: genotype p= 0.1798, brain region p= 0.2721, interaction p= 0.2721. Sidak’s multiple comparison test: striatum p= 0.1442). D-F) Representative immunoblots probed with total HTT antibody MAB2166 (top) and relative quantification (bottom) of HTT in the CTX, STR, HIP and CBL of Hu97/18 and Hu97/18xS littermates at D) 2 months (N=3 per genotype. Two-way ANOVA: genotype p= 0.0381, brain region p= 0.1269, interaction p= 0.0628. Sidak’s multiple comparison test: *p= 0.0374), E) 6 months (N=6 per genotype. Two-way ANOVA: genotype p= 0.0136, brain region p= 0.3418, interaction p= 0.3418. Sidak’s multiple comparison test: *p= 0.0280), and F) 10 months of age (N=8 per genotype. Two-way ANOVA: genotype p= 0.0022, brain region p= 0.0322, interaction p= 0.2331. Sidak’s multiple comparison test: **p= 0.0070). CTX = cortex, STR = striatum, HIP = hippocampus, CBL = cerebellum, IOD = integrated optical density.

