. 2022 Feb 16;11:e71476. doi: 10.7554/eLife.71476

Figure 6. Inhibiting calcium/calmodulin-dependent kinase II (CaMKII) in excitatory neurons or somatostatin (SST) interneurons resulted in imbalanced visuomotor responses in L2/3 excitatory neurons.

(A) We injected an AAV2/1-CaMKII-mEGFP-P2A-paAIP2 (in C57BL/6J mice) or AAV2/1-Ef1α-mEGFP-P2A-paAIP2 (in SST-Cre mice) unilaterally in V1 to express the photoactivatable CaMKII inhibitor paAIP2 in excitatory or SST interneurons, respectively, and an AAV2/1-Ef1α-NES-jRGECO1a bilaterally to express the calcium indicator jRGECO for imaging in L2/3 excitatory neurons. (B) Mice were dark-reared from birth. Adeno-associated viral vector (AAV) injections occurred at postnatal day 21 (paAIP2 or DIO-paAIP2) and P30 (jRGECO1a). Imaging window implantation occurred on P30. Mice had six sessions of visuomotor exposure in a closed-loop (CL) virtual environment during which we illuminated cortex bilaterally with blue light (473 nm) to inhibit CaMKII. We used six C57BL/6J mice, in which paAIP2 was targeted to excitatory neurons using a CaMKIIα(1.3 kb) promoter (paAIP2CaMKIIα), and seven SST-Cre mice that received an injection of the DIO-paAIP2 vector (paAIP2SST). (C) The average L2/3 population response to mismatch was stronger in control (black) than in paAIP2CaMKIIα (purple) hemispheres. Shading indicates the standard error of the mean (SEM) across neurons. Orange shading and bar indicate the duration of mismatch. Mean responses were compared across neurons in the time window marked by the black bar above the traces. Here and in subsequent panels, n.s.: p>0.05, *p<0.05, **p<0.01, ***p<0.001. For all details of statistical testing, see Supplementary file 1A. (D) As in (C), but for responses to the onset of a drifting grating stimulus (see Materials and methods). Green shading and bar indicate the presence of grating stimulus. (E) As in (C), but for running onset responses in the CL condition. (F) As in (C), but for inhibition of CaMKII in SST interneurons. (G) As in (D), but for inhibition of CaMKII in SST interneurons. (H) As in (E), but for inhibition of CaMKII in SST interneurons.

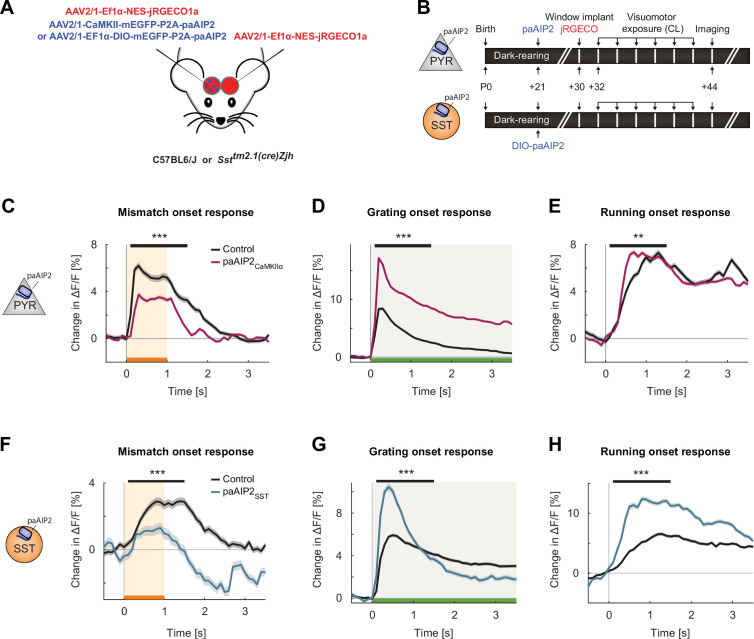
Figure 6.

Figure 6—figure supplement 1. Additional data for calcium/calmodulin-dependent kinase II (CaMKII) inhibition in excitatory or somatostatin (SST) inhibitory neurons.

Figure 6—figure supplement 1.

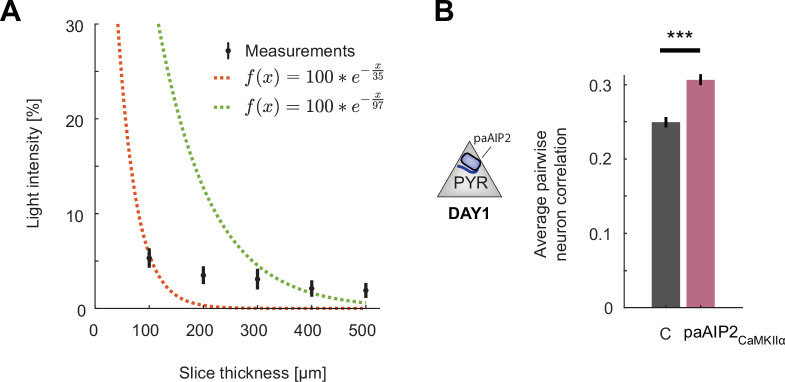
(A) Percentage of blue light (473 nm) power transmitted through acute slices of cortical tissue of varying thickness. Shown in black are mean and standard deviation over six slices. The dashed red line is a least-squares exponential fit with a decay constant of 37 µm, and the green line is the transform of a least-squares linear fit to the log-transformed data with a decay constant of 97 µm. Note that the data are not well fit by an exponential decay likely as a result of the point illumination. See Yona et al., 2016 for detailed modeling of power decay. (B) Average pairwise correlation of neuronal activity was higher in excitatory neurons in hemispheres that received CaMKII inhibition excitatory neurons (purple) compared to that in the uninhibited control hemisphere (gray). Error bars indicate the standard error of the mean (SEM), n.s.: p>0.05, *p<0.05, **p<0.01, ***p<0.001. For all details of statistical testing, see Supplementary file 1A.
Figure 6—figure supplement 2. Inhibiting calcium/calmodulin-dependent kinase II (CaMKII) in parvalbumin (PV) interneurons resulted in an overall increase in onset responses in L2/3 excitatory neurons.

Figure 6—figure supplement 2.

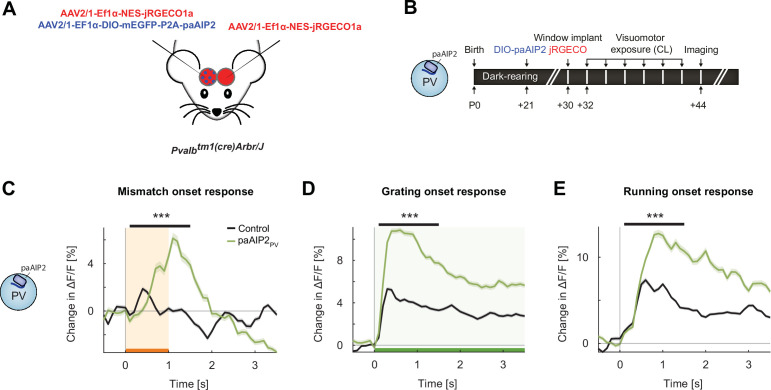
(A) We injected in V1 an AAV2/1-Ef1α-mEGFP-P2A-paAIP2 (in PV-Cre mice) unilaterally to express the photoactivatable CaMKII inhibitor paAIP2 in excitatory or PV interneurons, respectively, and an AAV2/1-Ef1α-NES-jRGECO1a bilaterally to express the calcium indicator jRGECO for imaging in L2/3 excitatory neurons. (B) Six PV-Cre mice were dark-reared from birth. Adeno-associated viral vector (AAV) injections occurred at postnatal day 21 (DIO-paAIP2) and P30 (jRGECO1a). Imaging window implantation occurred on P30. Mice had six closed-loop (CL) training sessions (visuomotor exposure) during which we illuminated cortex bilaterally with blue light (473 nm) to inhibit CaMKII (see Materials and methods). (C) The average population response to mismatch was stronger in the paAIP2PV (green) than in the control (black) hemispheres. Orange shading and bar indicate the duration of mismatch. Shading indicates the standard error of the mean (SEM). Mean responses are compared across neurons in the time window indicated by the black bar above the traces. Here and in subsequent panels, ***p<0.001. For all details of statistical testing, see Supplementary file 1A. (D) As in (C), but for responses to the onset of a drifting grating stimulus (see Materials and methods). Green shading and bar indicate the presence of grating stimulus. (E) As in (C), but for running onset responses in the CL condition.
Figure 6—figure supplement 3. Changes induced by calcium/calmodulin-dependent kinase II (CaMKII) inhibition quickly reverted with exposure to normal visuomotor coupling.

Figure 6—figure supplement 3.

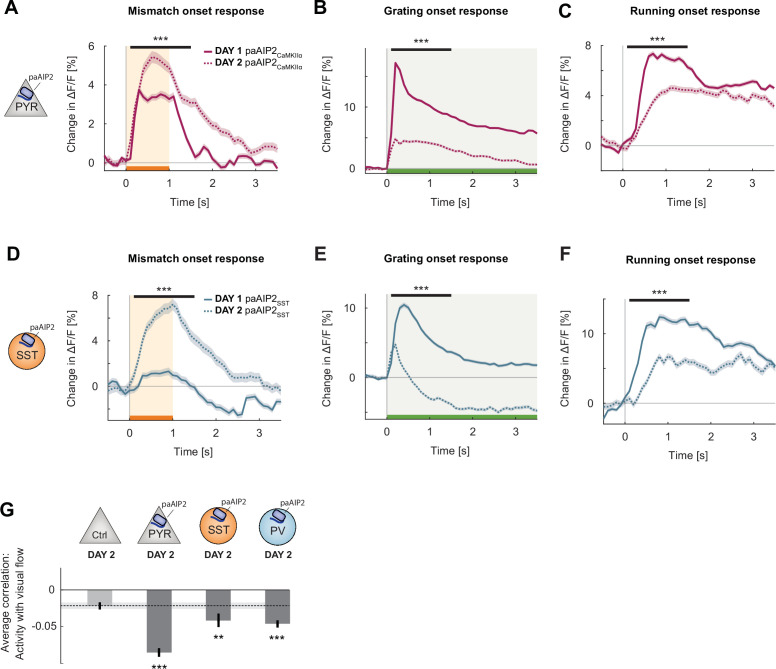
(A) The average L2/3 population response to mismatch on day 2 of imaging (dashed) and on day 1 of imaging (solid). Shading indicates the standard error of the mean (SEM) over neurons. Orange shading and bar indicate the duration of mismatch. Mean responses are compared across neurons in the time window indicated by the black bar above the traces. Here and in subsequent panels, **p<0.01, ***p<0.001. For all details of statistical testing, see Supplementary file 1A. (B) As in (A), but for responses to the onset of a drifting grating stimulus (see Materials and methods). Green shading and bar indicate the presence of grating stimulus. (C) As in (A), but for running onset responses in the closed-loop condition. (D) As in (A), but for inhibition of CaMKII in somatostatin (SST) interneurons using paAIP2. (E) As in (B), but for inhibition of CaMKII in SST interneurons using paAIP2. (F) As in (C), but for inhibition of CaMKII in SST interneurons using paAIP2. (G) Mean correlation between neuronal activity and visual flow in the open-loop condition for all L2/3 neurons recorded in the paAIP2-inhibited hemispheres of paAIP2CaMKIIα, paAIP2SST, and paAIP2PV mice on day 2, compared to the responses in the adult control group. Error bars indicate SEM across neurons. Dashed black line and corresponding gray shading indicate the mean correlation of activity and visual flow and SEM of the C57Bl6/J control group. Comparison against normally reared, adult control data.