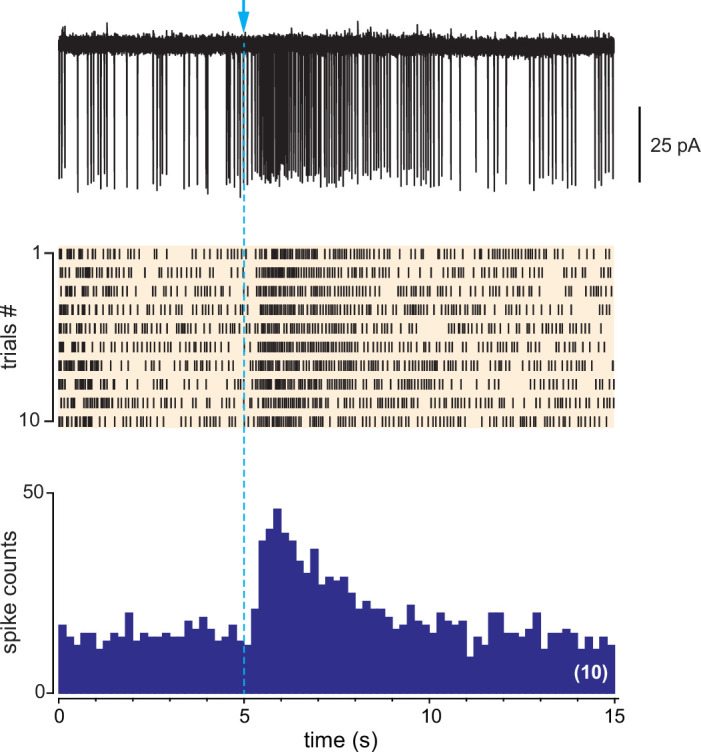
Figure 3. In dlx5/6 mice, a single photostimulation of basal forebrain (BF) axons evokes a biphasic inhibition-excitation response in periglomerular (PG) cells with a muscarinic excitation.
(A) Schematic of the virus injection in the horizontal limb of the diagonal band of Broca/magnocellular preoptic nucleus (HDB/MCPO) of dlx5/6Cre mice. (B) ChR2-eYFP expression in BF axons (yellow) in a sagittal section of the olfactory bulb (OB). DAPI staining (blue) delimits the different layers (GL: glomerular layer; EPL: external plexiform layer; MCL: mitral cell layer; GCL: granule cell layer). Scale bar 100 µm. Higher-resolution image in Figure 3—figure supplement 1. (C) Representative spiking response, raster plot, and cumulative peri stimulus time histogram (PSTH) (10 consecutive sweeps, 200 ms/bin) of a typical biphasic inhibition-excitation response evoked by a single photostimulation of BF fibers and recorded over 15 s in a PG cell from a dlx5/6 mouse. (D) Average spiking frequency per bin (200 ms) and per episode. Each gray line corresponds to a cell. The black line is the ensemble average. Photostimulation at blue arrow. Only one cell in the dataset responded with a long-lasting excitation that was not preceded by an inhibitory component (Figure 3—figure supplement 3). (E) The nonselective muscarinic ACh receptor (mAChR) antagonist atropine (10 µM) blocked BF-evoked excitation. (F) Firing rate before (pre) and after (post) photostimulation of BF axons in artificial cerebrospinal fluid (ACSF) (green) in the presence of 6-nitro-7-sulfamoylbenzo[f]quinoxaline-2,3-dione (NBQX), D-2-amino-5-phosphonopentanoic acid (D-AP5), and mecamylamine (violet) or in the presence of the muscarinic receptor antagonist atropine (n = 7) or scopolamine (n = 2) (red). Each line indicates a cell. Blue circles indicate means. Paired t-test.

Figure 3—figure supplement 1. Higher-resolution image of Figure 3B showing the distribution in the olfactory bulb (OB) of a dlx5/6 mouse of eYFP-expressing axons from basal forebrain (BF) cholinergic and GABAergic neurons.

Figure 3—figure supplement 2. Basal forebrain (BF) inputs have various impacts on periglomerular (PG) cells activity in dlx5/6 mice.

Figure 3—figure supplement 3. the unique example, in a dlx5/6 mouse, of a cell responding with a long-lasting excitation that was not accompanied by a transient inhibitory phase immediately after the flash.