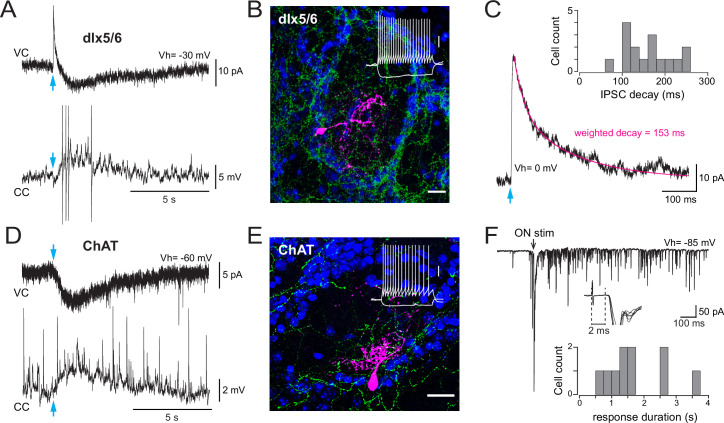
Figure 5. Basal forebrain (BF) cholinergic inputs produce a slow muscarinic EPSC in type 2.3 periglomerular (PG) cells.
(A) Biphasic GABAergic-muscarinic voltage-clamp (VC) and current-clamp (CC) whole-cell responses to a single photostimulation (blue arrow) of BF axons in a cell from a dlx5/6 mouse. Responses recorded in the presence of 6-nitro-7-sulfamoylbenzo[f]quinoxaline-2,3-dione (NBQX), D-2-amino-5-phosphonopentanoic acid (D-AP5), and mecamylamine. The current is an average of eight consecutive sweeps, the voltage response is a single trace eliciting four spikes (truncated for display). (B) Morphology of a biocytin-filled PG cell in which photostimulation of BF axons (eYFP-positive, green) produced a dual GABA-ACh response in a dlx5/6 mouse. DAPI staining (blue) shows the outline of the glomerulus. Scale bar 20 µm. Inset: voltage responses of this cell to depolarizing and hyperpolarizing current steps (20 pA, 500 ms). Scale bar 20 mV. (C) Photo-evoked GABAergic IPSC recorded in the same PG cell as in (A) at a holding potential of 0 mV. Average of 10 sweeps. The decay was best fitted with two exponentials (magenta) with a weighted decay time constant of 153 ms. Inset: distribution histogram of the decay time constants of photo-evoked GABAergic IPSCs in PG cells with a mixed GABA/ACh response in dlx5/6 mice. (D) Photo -evoked muscarinic EPSC (VC) and EPSP (CC) recorded in artificial cerebrospinal fluid (ACSF) in a PG cell from a choline acetyltransferase (ChAT) mouse. Average of six consecutive sweeps for the EPSC, single trace for the EPSP. (E) Morphology of a biocytin-filled cell that responded to the photostimulation of BF cholinergic axons with a muscarinic excitation in a ChAT mouse. Scale bar 20 µm. Blue: DAPI; green: eYFP-positive BF axons. Inset: membrane voltage responses of this cell to the injection of current steps (–20/+ 35 pA, 500 ms). Scale bar 20 mV. (F) Long-lasting barrage of EPSCs evoked by an electrical stimulation of the olfactory nerves (black arrow, 0.1 ms/100 µA) in the cell shown in (E). Inset: zoom on the earliest phase of the response (six consecutive traces, truncated for display). Responses had onset latencies > 2 ms. The distribution histogram shows the duration of the olfactory nerve (ON)-evoked response elicited in 10 cells receiving a muscarinic excitation (seven cells from dlx5/6 mice and three cells from ChAT mice).

