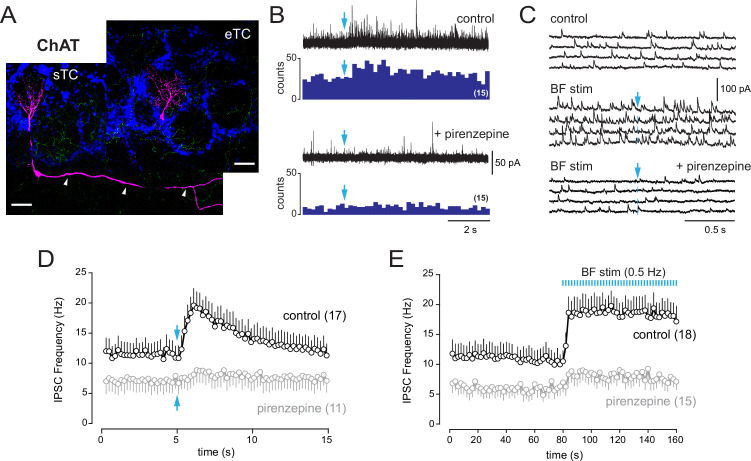
Figure 7. Basal forebrain (BF) muscarinic inputs lead to an increase of inhibitory synaptic inputs in tufted cells.
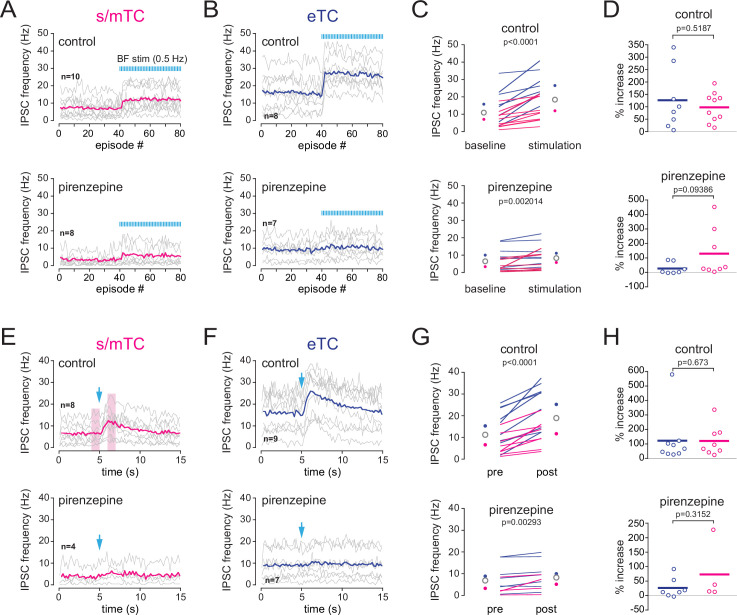
(A) Morphologies of two biocytin-filled tufted cells recorded in different slices from choline acetyltransferase (ChAT) mice. The localization of the soma and the presence or not of lateral dendrites in the external plexiform layer (arrowheads) distinguish a superficial tufted cell (sTC) (left) and an external tufted cell (eTC) (right). DAPI staining (blue) shows the outline of glomeruli. ChR2-eYFP-expressing cholinergic fibers are visible in green. Scale bars 50 µm. (B) Increase of inhibition evoked by a single photostimulation (blue arrow) of the cholinergic axons in an sTC (top). Pirenzepine (2 µM) blocked this response (bottom). Five traces are superimposed in each condition. Peri stimulus time histograms (PSTHs) show the cumulative number of IPSCs/bin (200 ms) across 15 consecutive trials. (C) Four consecutive traces of spontaneous IPSCs recorded in an eTC in control condition (top) and during low-frequency photostimulation of the cholinergic BF fibers (one flash every 2 s at blue arrow, middle). Pirenzepine (2 µM) blocked the increase of IPSC frequency evoked by the photostimulations (bottom). (D) Average IPSC frequency per 200 ms bin and per episode for 17 tufted cells (eight s/mTC and nine eTC). BF axons were photostimulated once (blue arrow). Pirenzepine was tested on 11/17 cells and reduced photo-evoked increase of IPSCs. (E) Average IPSC frequency per episode (2 s) for 18 cells (10 s/mTC and 8 eTC). Photostimulation of the cholinergic fibers at 0.5 Hz rapidly and persistently increased IPSC frequency. Pirenzepine was tested in 15/18 cells. Experiments were done in ChAT mice in the presence of 6-nitro-7-sulfamoylbenzo[f]quinoxaline-2,3-dione (NBQX), D-2-amino-5-phosphonopentanoic acid (D-AP5), and mecamylamine. Individual data points are shown in Figure 7—figure supplement 1.


