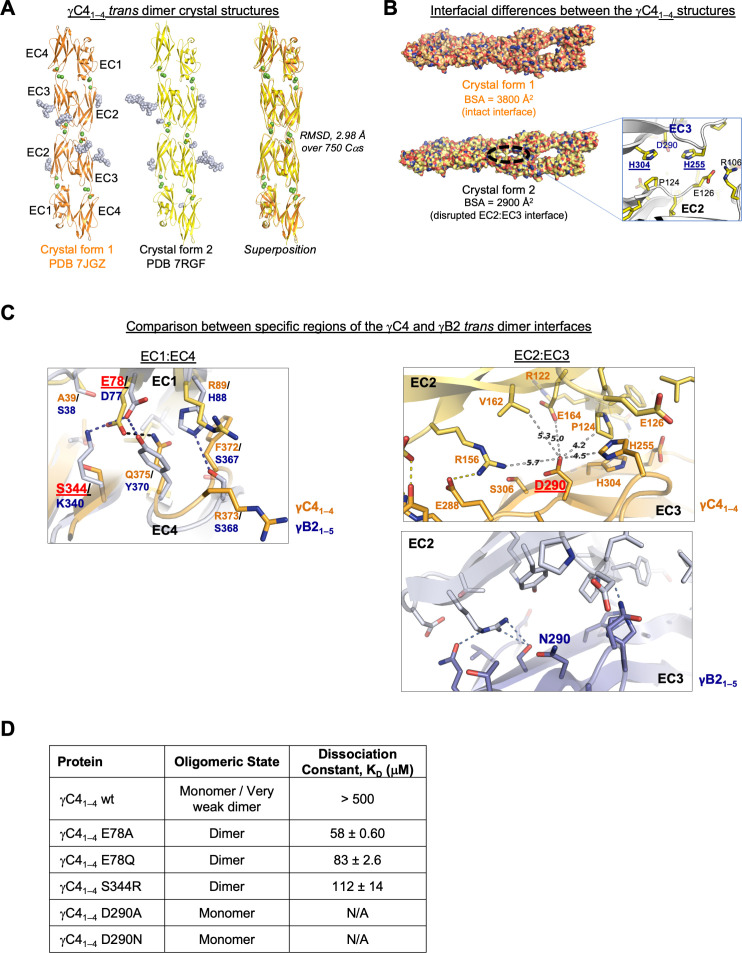
Figure 3. C-type clustered protocadherin (cPcdh) γC4 adopts an EC1–4-mediated head-to-tail trans dimer like alternate cPcdhs with a comparatively weak dimer affinity.
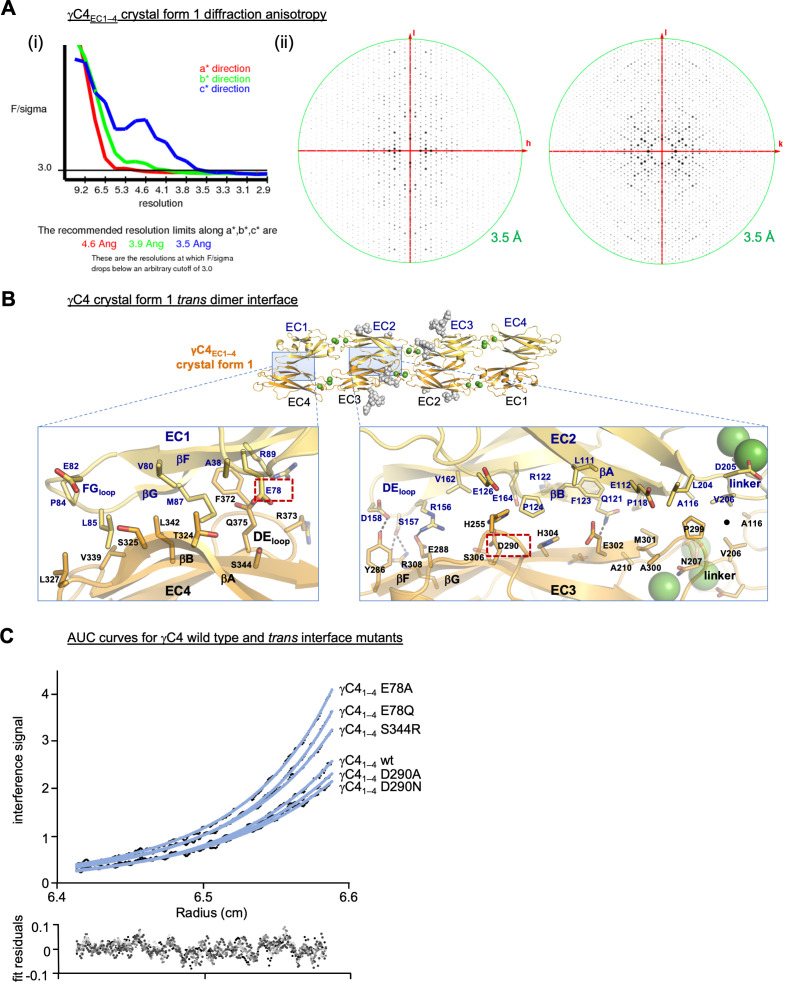
(A) Ribbon diagrams of the γC4EC1–4 trans dimer crystal structures obtained from two different crystal forms. Bound calcium ions are shown as green spheres and glycans are shown in pale blue spheres. (B) The two crystal structures have a markedly different trans interface buried surface area (BSA). Left, surface views of the two trans dimer crystal structures highlight the difference, with a gap apparent in the EC2:EC3 region of the interface in crystal form two that is absent from crystal form 1. Surfaces are colored by atom type with the carbons colored orange for crystal form one and yellow for crystal form 2. Right, close-up view of the gap region in the crystal form two dimer with the side chains depicted as sticks. The intact crystal form 1 γC4 dimer is similar overall to those of the published intact alternate α, β, γA, and γB cPcdhs and the published δ2 nonclustered (nc) Pcdh trans dimers (root mean square deviation [RMSD] over aligned Cαs 2.4–4.5 Å; Figure 3—source data 2). The published crystal structures of γA1, γA8, and γB3 also show partially disrupted trans interfaces though in differing regions of the interface (Goodman et al., 2016a, Nicoludis et al., 2016). (C) Comparison between the (i) EC1:EC4 and (ii) EC2:EC3 regions of the γC4 (orange) and γB2 (blue, PDB 5T9T) trans dimer interfaces. Potential hydrogen bonds are depicted as dashed black/yellow (γC4) or blue (γB2) lines. (i) Structural alignment of the EC1:EC4 portion of the γC4 and γB2 trans dimers highlights a possible destabilizing role for γC4 residue E78 since unlike its counterpart in γB2 (D77), it is not juxtaposed with a basic residue. (ii) Similarly, an additional negatively charged residue (D290) which occupies a central position in the γC4 EC2:EC3 interface may also contribute to γC4’s comparatively weak trans dimer interaction. Distances between the D290 side chain and its nearest contacts are shown as dashed gray lines with distances given in Angstroms. (D) Sedimentation equilibrium analytical ultracentrifugation (AUC) experiments were conducted on γC4 EC1–4 wild-type (wt) and interface mutants to assess whether E78 and D290 negatively impact trans dimerization. Table details the oligomeric state and dissociation constants for each protein tested.


