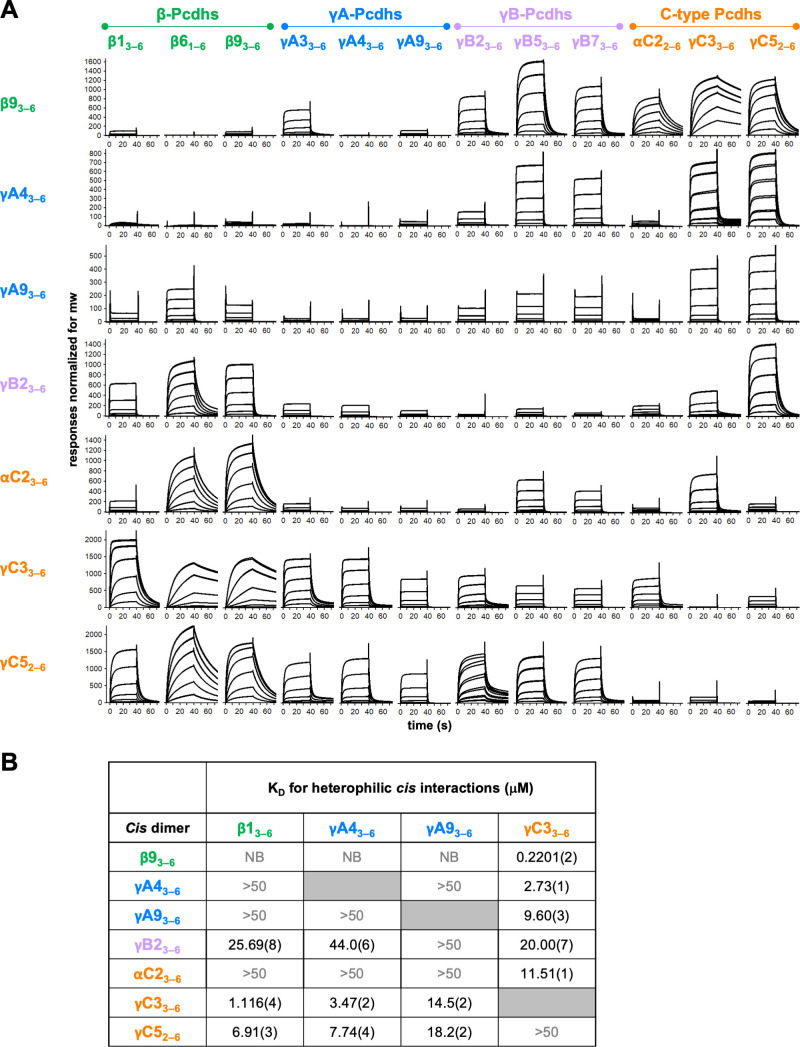
Figure 4. Clustered protocadherin (cPcdh) cis interactions are promiscuous with a preference for interfamily heterodimers.
(A) Surface plasmon resonance (SPR)-binding profiles of cPcdh cis fragment analytes from all cPcdh subfamilies except alphas (shown in columns) flowed over individual surfaces coated with cPcdh cis fragments. Binding profiles for each surface are individually scaled and responses are normalized for molecular weight. (B) Table of dissociation constants calculated from the SPR data for the four monomeric analytes. The number in brackets represents the error of the fit based on analysis of duplicate responses. Binding signals were not detected for interactions labeled NB (no binding) while >50 represents interactions with KDs > 50 μM, where an accurate KD cannot be determined.


