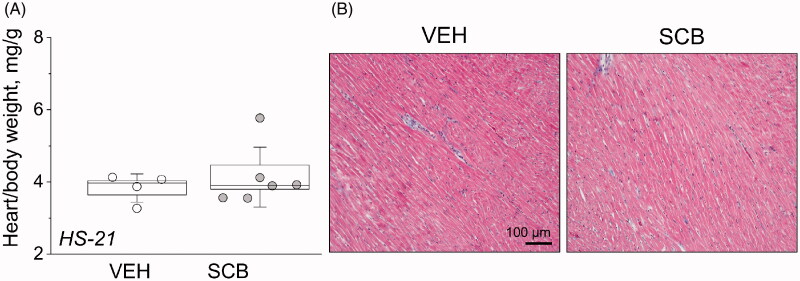
Figure 2.
Sacubitril’s effects on the heart. (A) Endpoint heart-to-total body weight ratios. (B) Histological characterization of cardiac tissue using Masson trichrome staining. Representative images of cardiac tissues from experimental rats isolated at the end point of the experimental protocol [high-salt diet, upon administration of vehicle (VEH) or sacubitril (SCB)]. One-way ANOVA was used for statistical analysis. p values are shown for comparisons where p < .05.

