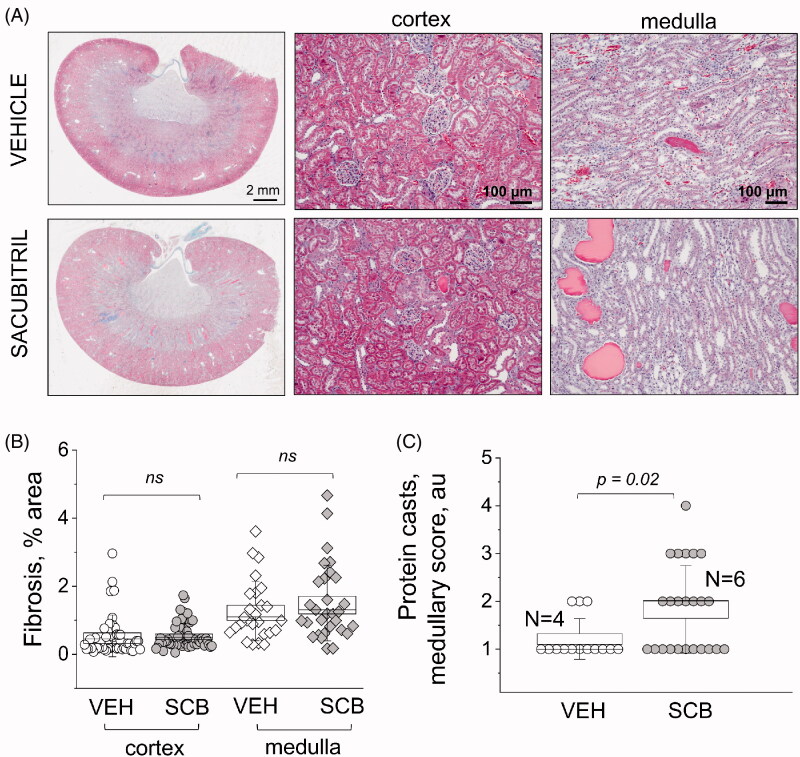
Figure 3.
Histological characterization of renal damage with Masson trichrome staining. (A) Representative images of cortical and medullary renal tissues from experimental rats isolated at the end point of the experimental protocol [high-salt diet, upon administration of vehicle (VEH) or sacubitril (SCB)]. The first column shows scans of coronal midsections of kidneys stained with Masson trichrome; fibrotic tissue appears blue. The second and third columns demonstrate representative images taken in the cortexes and medulla, respectively. (B and C) graphs summarizing the analysis of percentage of fibrosis (B) and protein cast scoring (C). a.u., arbitrary units. Two-way ANOVA with Tukey post-hoc was used for significance comparisons. Each point on the graphs denotes data obtained from one image, with 16 images being taken per kidney: 10 from each cortex, and 6 from each medulla. p values are shown for comparisons where p < .05.

