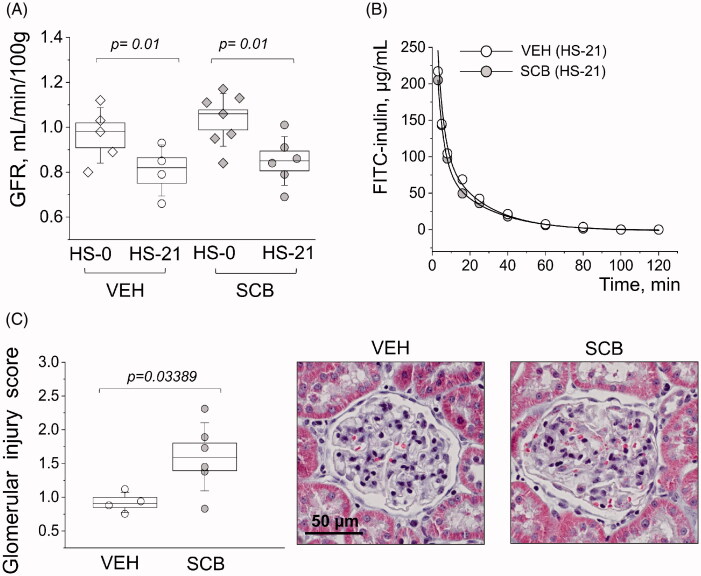
Figure 4.
Characterizations of glomerular function and damage. (A) Start vs endpoint glomerular filtration rates (GFR). (B) Representative FITC-inulin clearance curves from conscious freely moving rats injected with FITC-inulin. (C) Glomerular injury as determined by scoring individual glomeruli for damage; each point is an average of 100 randomly scored glomeruli per kidney. Images are representatives of glomeruli from Masson trichrome stained tissues, from VEH and SCB animals. Two-way ANOVA with Tukey post-hoc was used for significance comparisons. p values are shown for comparisons where p < .05.

