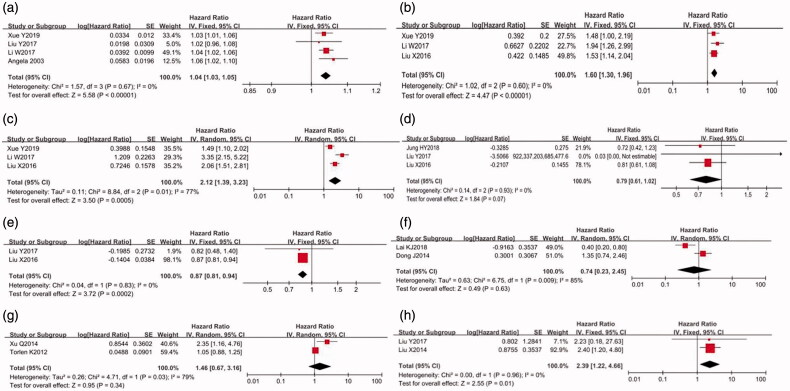
Figure 3.
Forest plots for the hazard risk (HR) between risk factors and cardiovascular mortality in PD patients (a) age (per 1 year increase); (b) diabetes mellitus; (c) cardiovascular disease; (d) albumin (mg/dl); (e) hemoglobin (g/dl); (f) uric acid (high vs low); (g) potassium (low vs high); (h) alkaline phosphatases (U/l)).

