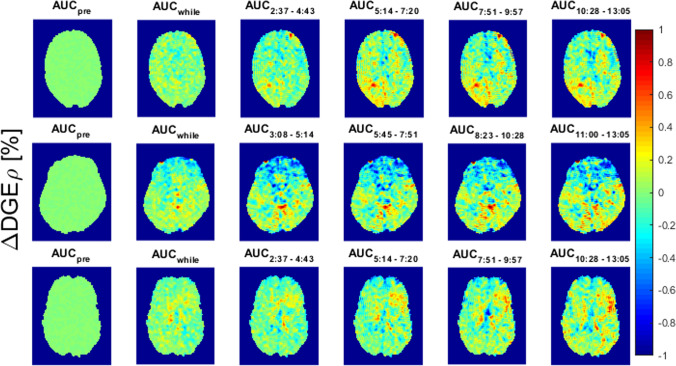
Fig. 2.
∆DGE⍴ AUC maps for patients 8 (1st row, slice 6). 4 (2nd row, slice 7) and 11 (3rd row, slice 6). The maps show the AUC during different timeframes: mean ∆DGE⍴ values before injection (1st column), during injection (2nd column) and after the injection (3rd-5th column). The time in the subscript indicates the timeframe after the beginning of the injection. Supplemental Fig. 1: ΔDGEρ at 8–10 min post-injection for each measured offset: each box plot consists of all voxels within the respective ROIs. ROIs of contrast-enhancing tumor, of tumor necrosis, of T2-hyperintense tumor without contrast enhancement, and in normal-appearing white matter were analyzed. Similar effects were measured at all offsets

