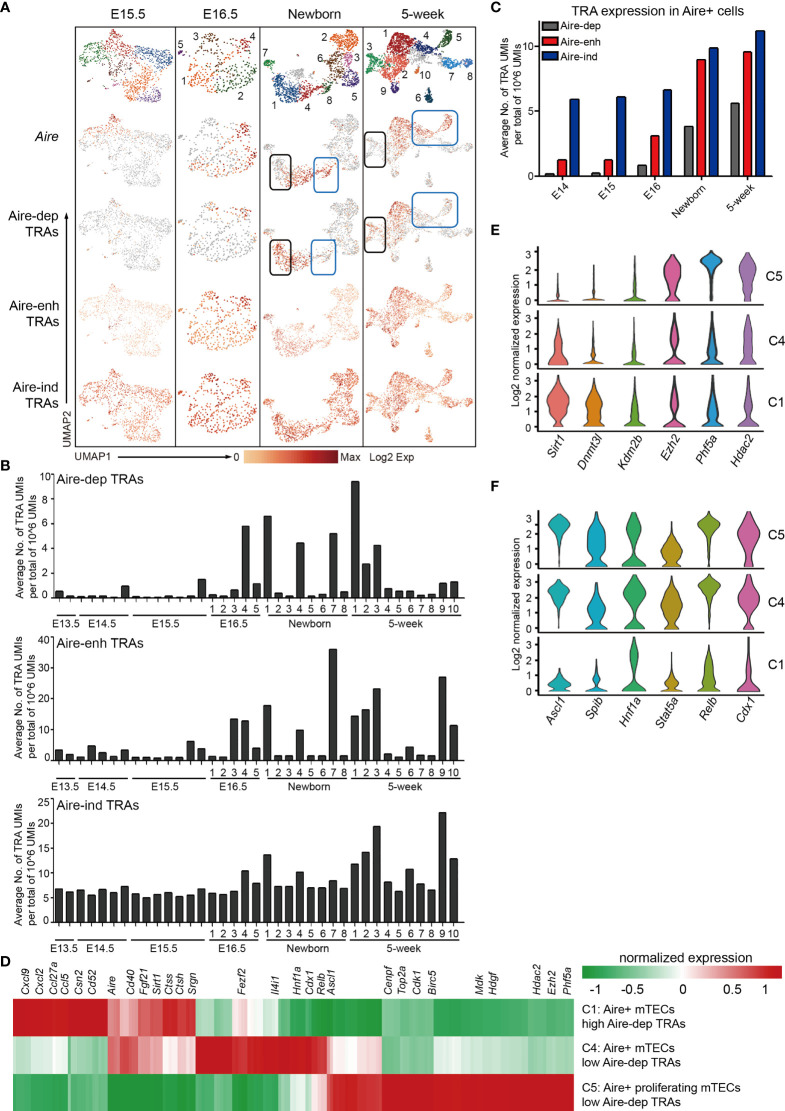
Figure 5.
Characteristics of tissue-restricted antigen expression during mTEC development. (A) UMAP visualization of the expression of Aire, Aire-dep TRAs, Aire-enh TRAs, and Aire-ind TRAs in E15.5, newborn, and 5-week thymus. Each point corresponded to a single cell, and each color represented a cell cluster (first panel). Color represented maximum-normalized mean expression of Aire and TRAs (2–4 panels). (B) Average TRAs expression in each cell cluster in E13.5, E14.5, E15.5, E16.5, newborn, and 5-week thymus (upper panel, Aire-dep TRAs; middle panel, Aire-enh TRAs; lower panel, Aire-ind TRAs). (C) Average TRAs expression in Aire+ cells in E14.5, E15.5, E16.5, newborn, and 5-week thymus. Aire+ cells were selected as ≧ 2 UMI counts in a single cell. (D) Heat map showing differently expressed genes in C1 (cluster 1), C4, and C5 cells from 5-week thymus. (E, F) Violin plots showing the smoothened expression distribution of selected genes in C1, C4, and C5 cells from 5-week thymus.

